speed
OEE & Downtime
OEE & Downtime
Analytics at Scale
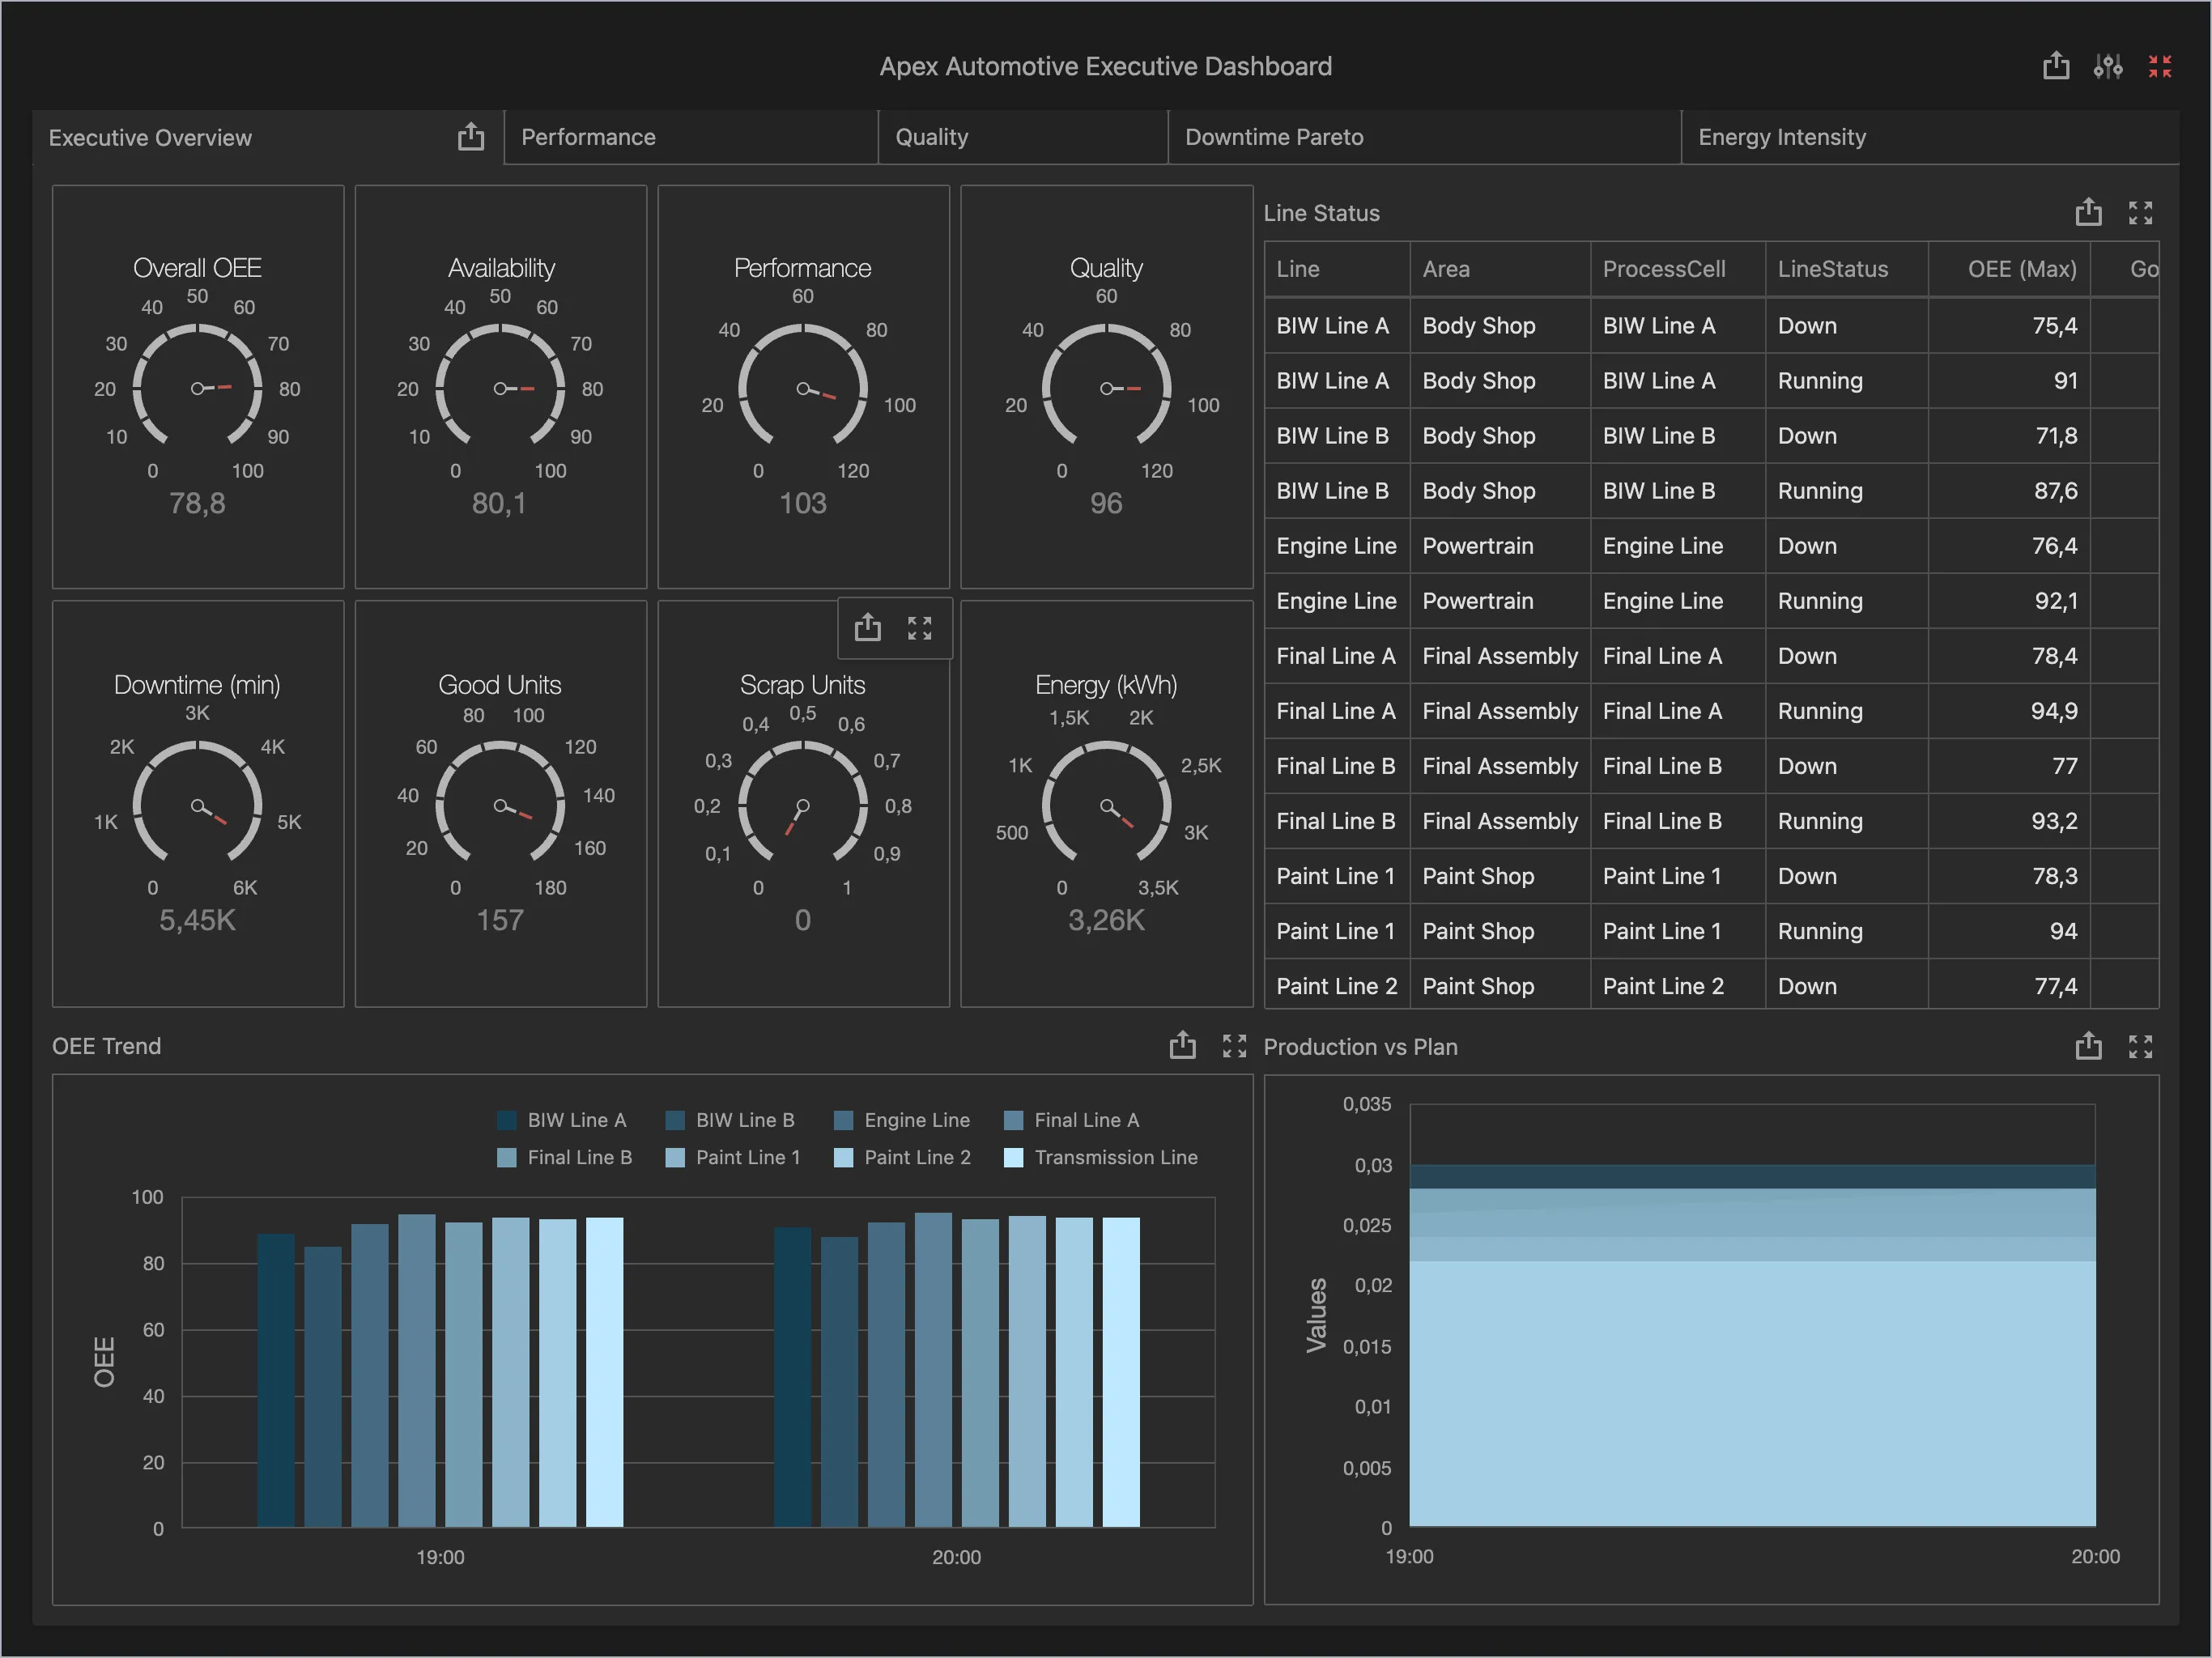
Capture every stop, changeover, and speed loss across lines. Proxus unifies PLC tags and shift data so you can measure OEE and fix the real causes.
+12%
OEE with root-cause visibility
Minutes
Detect micro-stops in real time
1 Model
Standard tags across all lines
What makes it work
Proxus turns raw PLC signals into a reliable OEE layer. Capture stops and changeovers once, then reuse the same logic across lines and plants.
- check_circle Connectivity for PLCs and SCADA using industrial drivers.
- check_circle UNS mapping for consistent OEE tags with Unified Namespace.
- check_circle Dashboards for live OEE and downtime analytics.
Typical OEE signals
Run/stop state
Cycle time
Good vs scrap
Changeover time
How it works
01
Capture downtime
Track stop events and classify reasons on the edge.
02
Normalize tags
Apply the same tag model across lines and plants.
03
Analyze trends
Compare shifts, plants, and products in real time.
FAQ
Common questions about OEE analytics.
Can we track micro-stops?
Yes. Proxus captures short stops and correlates them with shifts and batches.
Does it work with our historian?
Yes. Proxus can feed your historian or store data with time-series storage.
How fast can we deploy?
Start with a single line and replicate the same template across sites.
See the real causes of downtime
Turn PLC signals into OEE insights with Proxus.