
What is online now?
Read runtime freshness and gateway evidence for the devices the current user can see. Keep configuration enabled state separate from live health.
Give approved AI agents the operational context to answer with evidence: current device health, configuration, dependency paths, telemetry history, and permitted business actions. Keep identity, scope, and control boundaries inside Proxus.
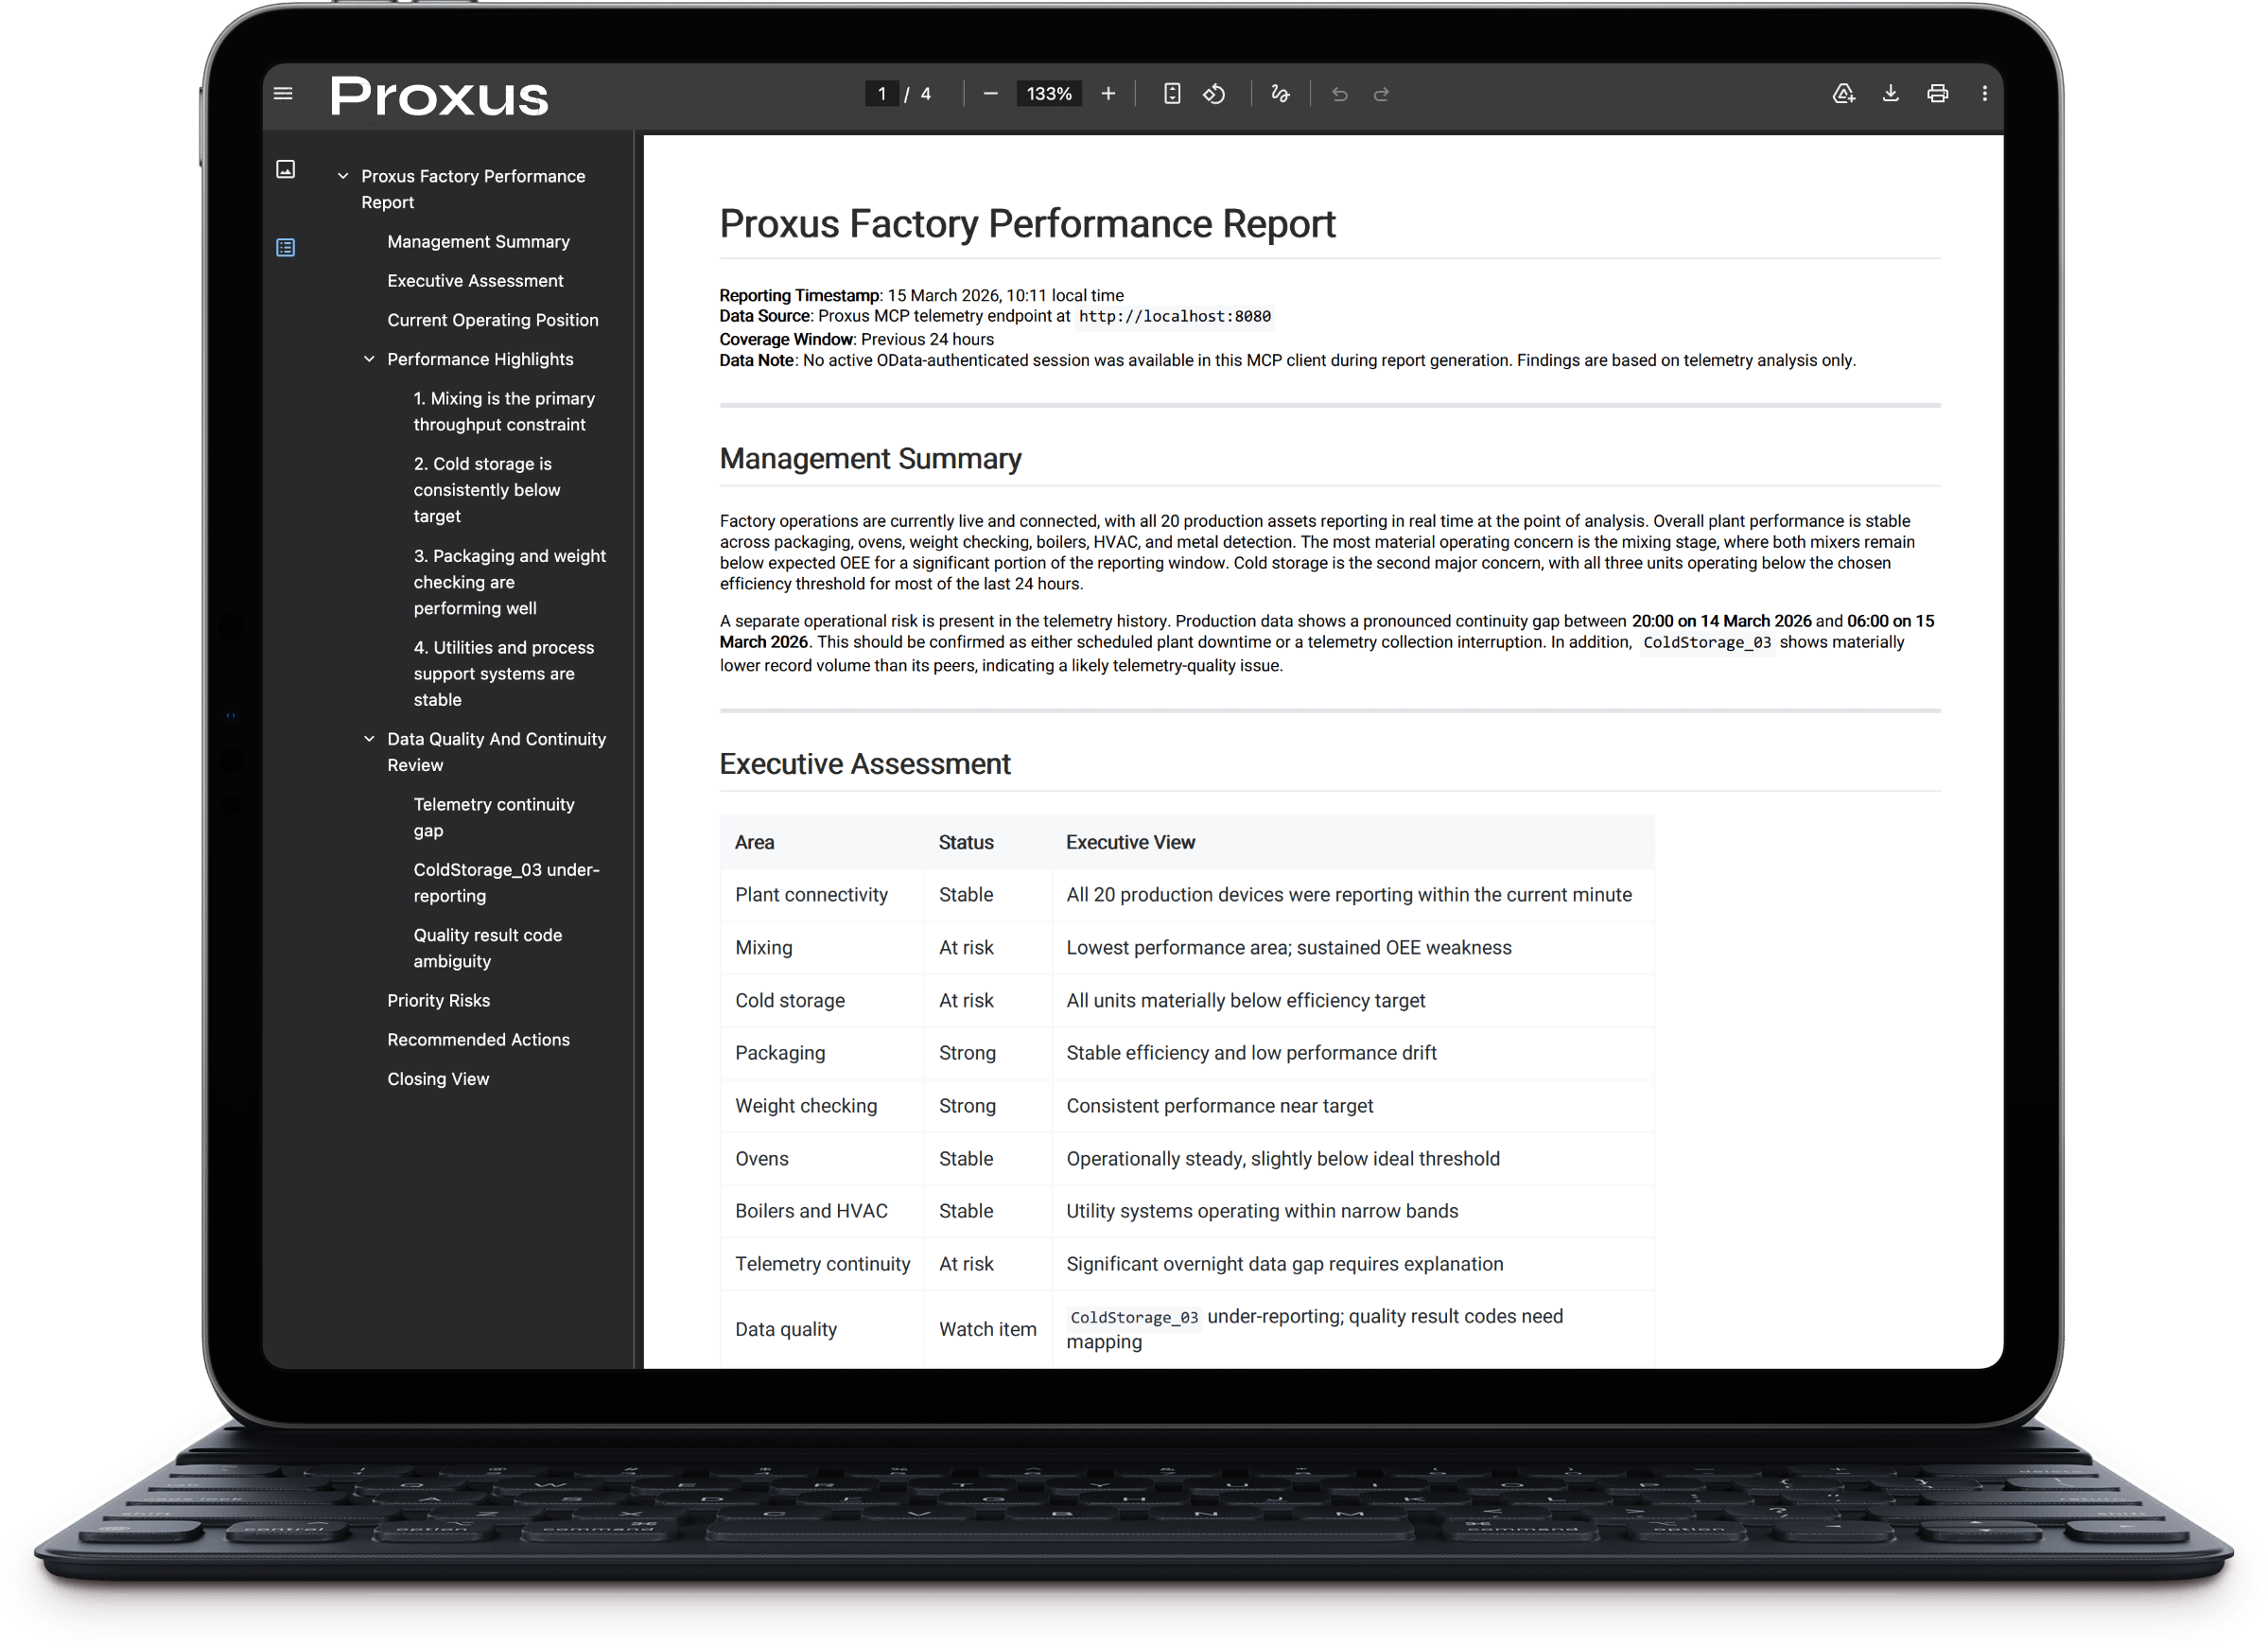
This report was produced from governed Proxus context. The visual remains unmasked so teams can inspect the findings, evidence boundaries, and operational summary rather than seeing an abstract AI illustration.
The server publishes its authentication workflow, tool contracts, entity schema, evidence semantics, limits, and recovery actions. Users do not have to write a perfect master prompt for every assistant.
Live tool schemas and platform overview route the agent to current device status, graph, telemetry, logs, or governed entities.
The connected agent operates as the selected Proxus user. Existing role, object, field, gateway, and UNS scope remain authoritative.
Bounded dependency and telemetry workflows keep evidence, freshness, redactions, omitted scope, and resource limits visible.
Structured errors tell the agent which input, permission, catalog refresh, or narrower query is required instead of ending the workflow with a generic failure.
Proxus connects devices, profiles, tags, rules, functions, dashboards, alerts, gateways, and telemetry evidence into a bounded operational graph. Relationships keep their source, confidence, and redaction context.
Follow the graph workflowBefore a profile, tag, rule, or function changes, find the downstream consumers that may be affected.
Follow an alert, dashboard, or function upstream to the configuration and telemetry semantics that feed it.
Rank cycle-safe paths for a specific maintenance, runtime, or evidence question without treating bounded scope as proof of absence.
See whether a relationship comes from typed configuration, desired runtime state, parsed rule, dashboard, or function semantics.
Read runtime freshness and gateway evidence for the devices the current user can see. Keep configuration enabled state separate from live health.
Walk downstream dependencies, preserve confidence and source, and expose when the graph is bounded, redacted, or unable to prove a dynamic relationship.
Trace the alert to its rule, device, and telemetry key, then inspect a narrow time window to compare the measured value with the recorded event.
A protected call is resolved to one Proxus identity, checked against existing permissions, bounded by the tool contract, and audited. Database credentials and control-system sessions are not handed to the agent.
Start with a governed read-only deployment, validate permission boundaries with real restricted users, then enable only the business operations your teams approve.