v1.5.4: Operations Center, Live Stream Intelligence & Unit Flow
Introduces Operations Center as the primary operational cockpit with signal insights, incident timeline, and topology-first monitoring, plus end-to-end unit flow.
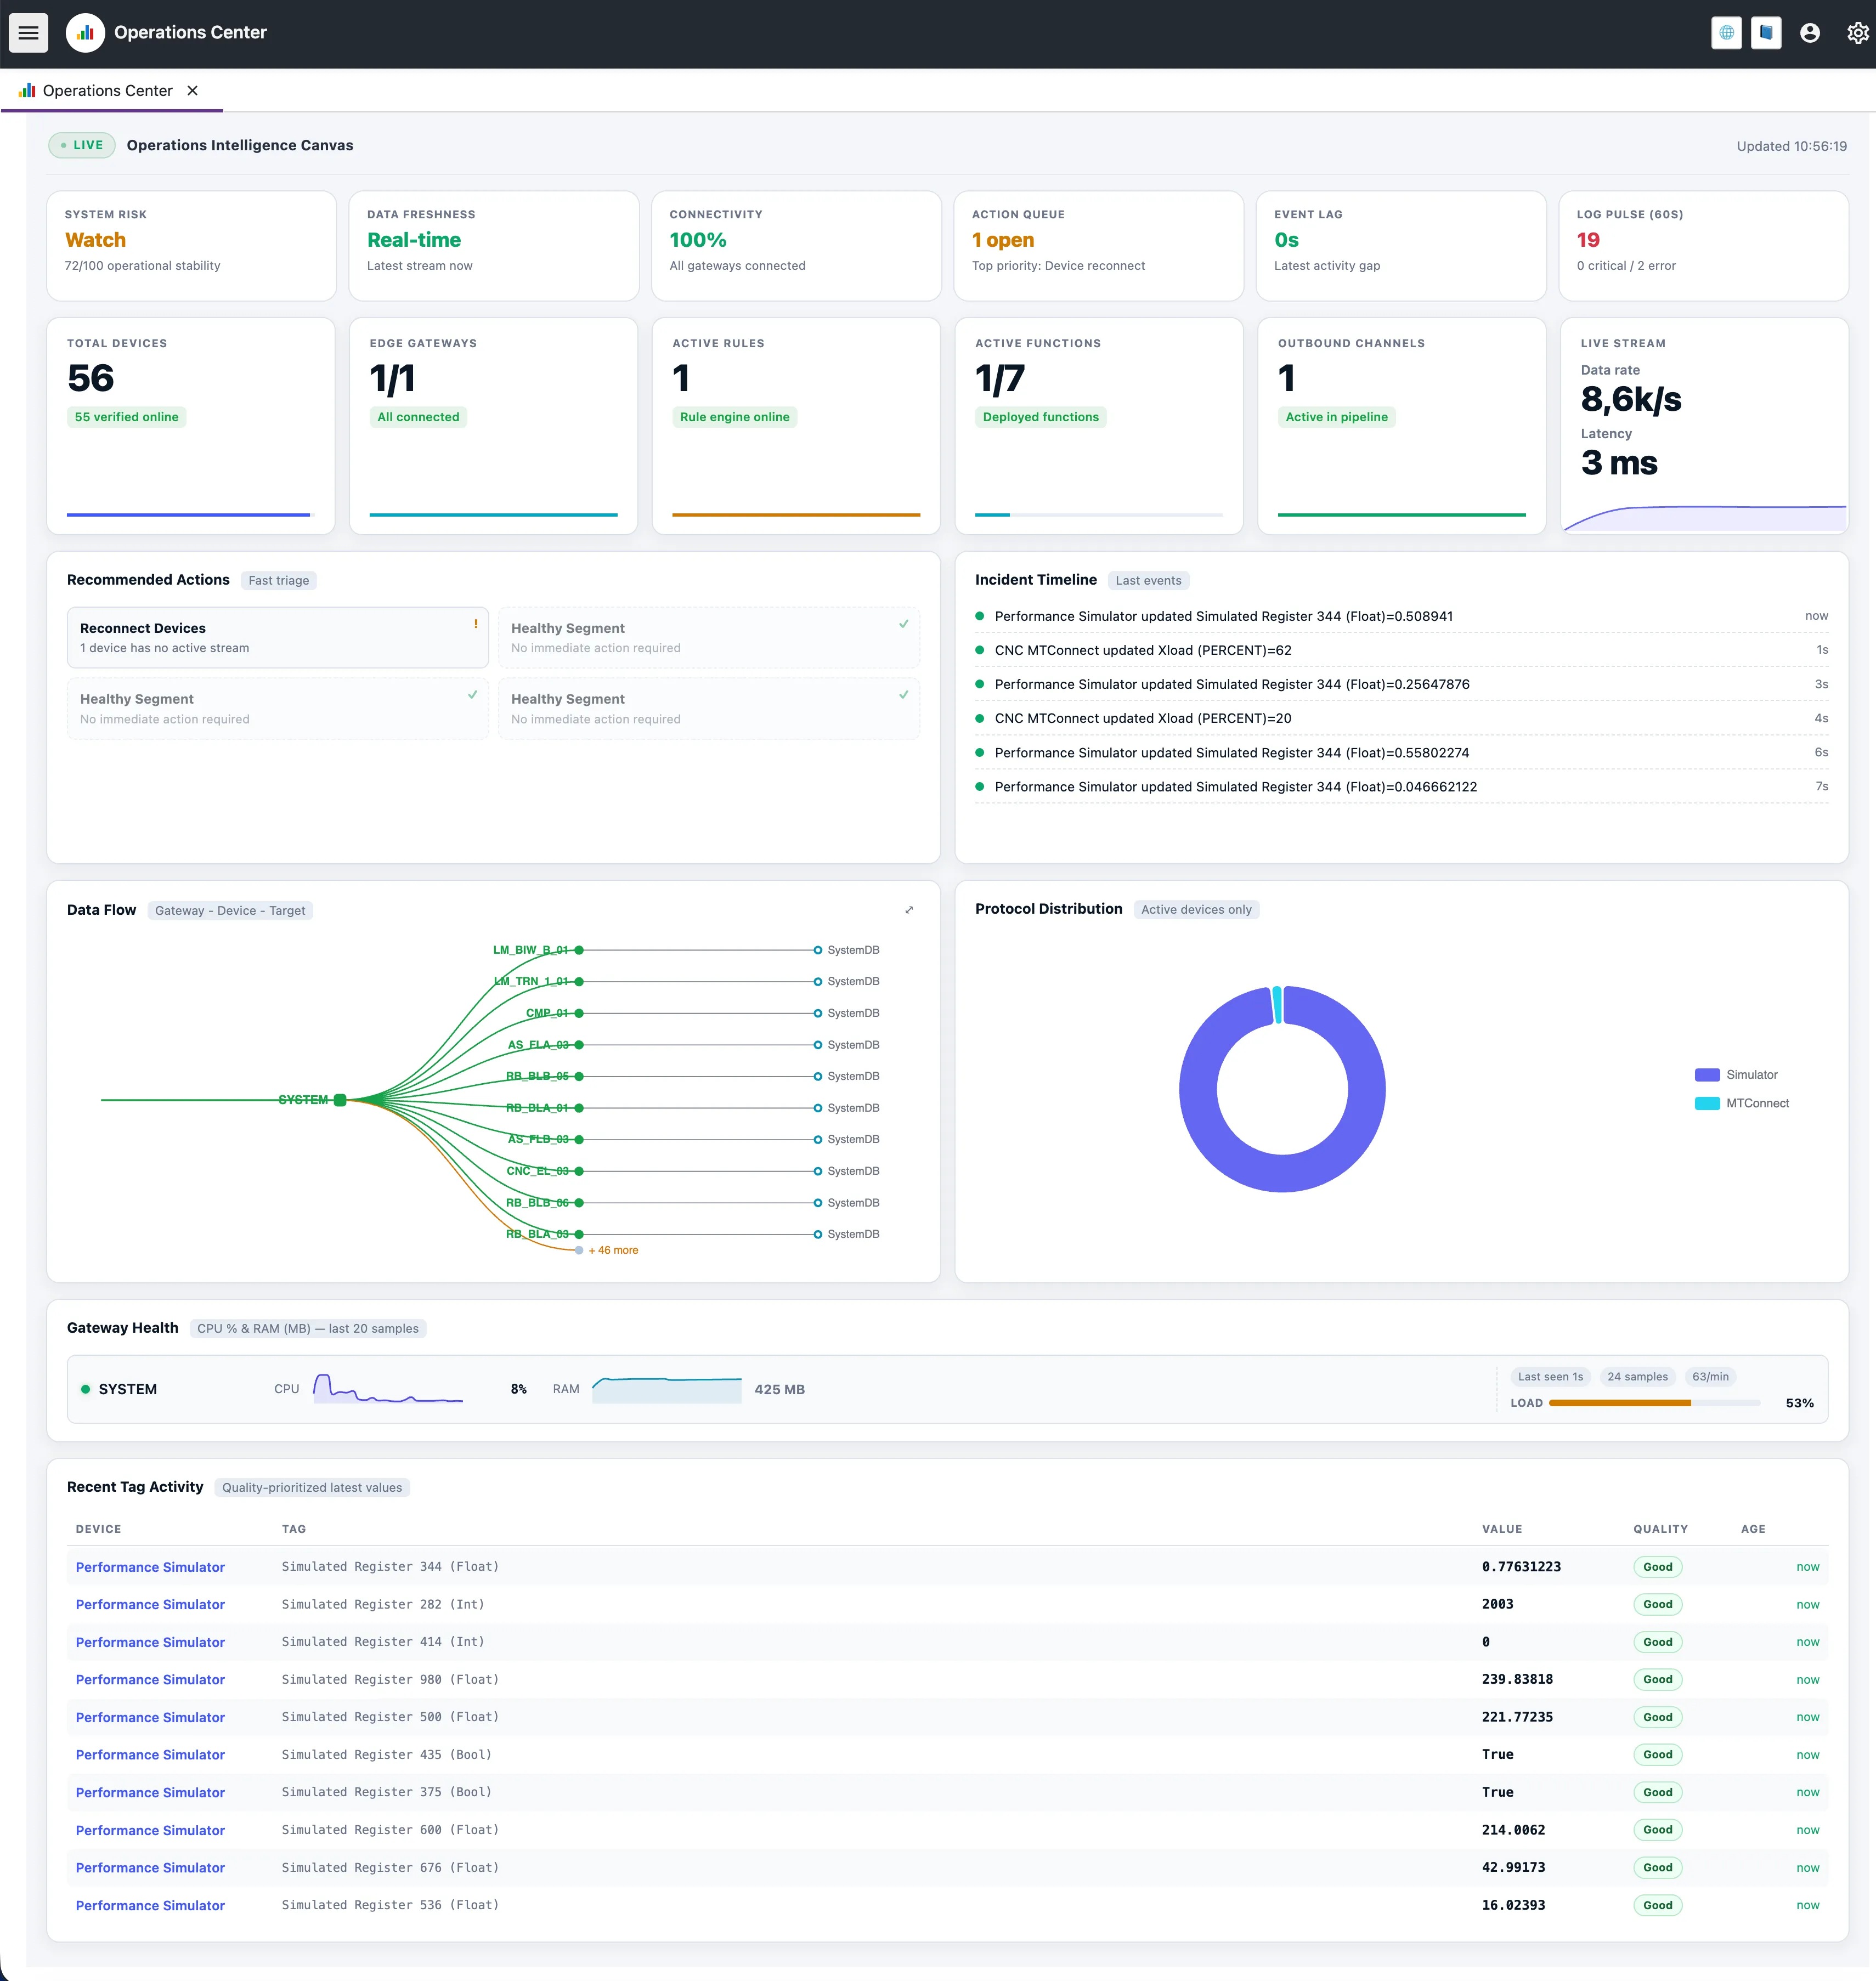
Version 1.5.4 introduces Operations Center as the primary operational cockpit for real-time monitoring and incident triage.
✨ New Features
Operations Center
Signal Row insights: System Risk, Data Freshness, Connectivity, Action Queue, Event Lag, and Log Pulse are presented as actionable insight cards.
Unified operational canvas: Device health, edge status, data flow topology, protocol distribution, and incident timeline are shown in one place.
Faster triage workflow: Recommended actions and timeline context help teams move from detection to intervention with less context switching.
Operations Center
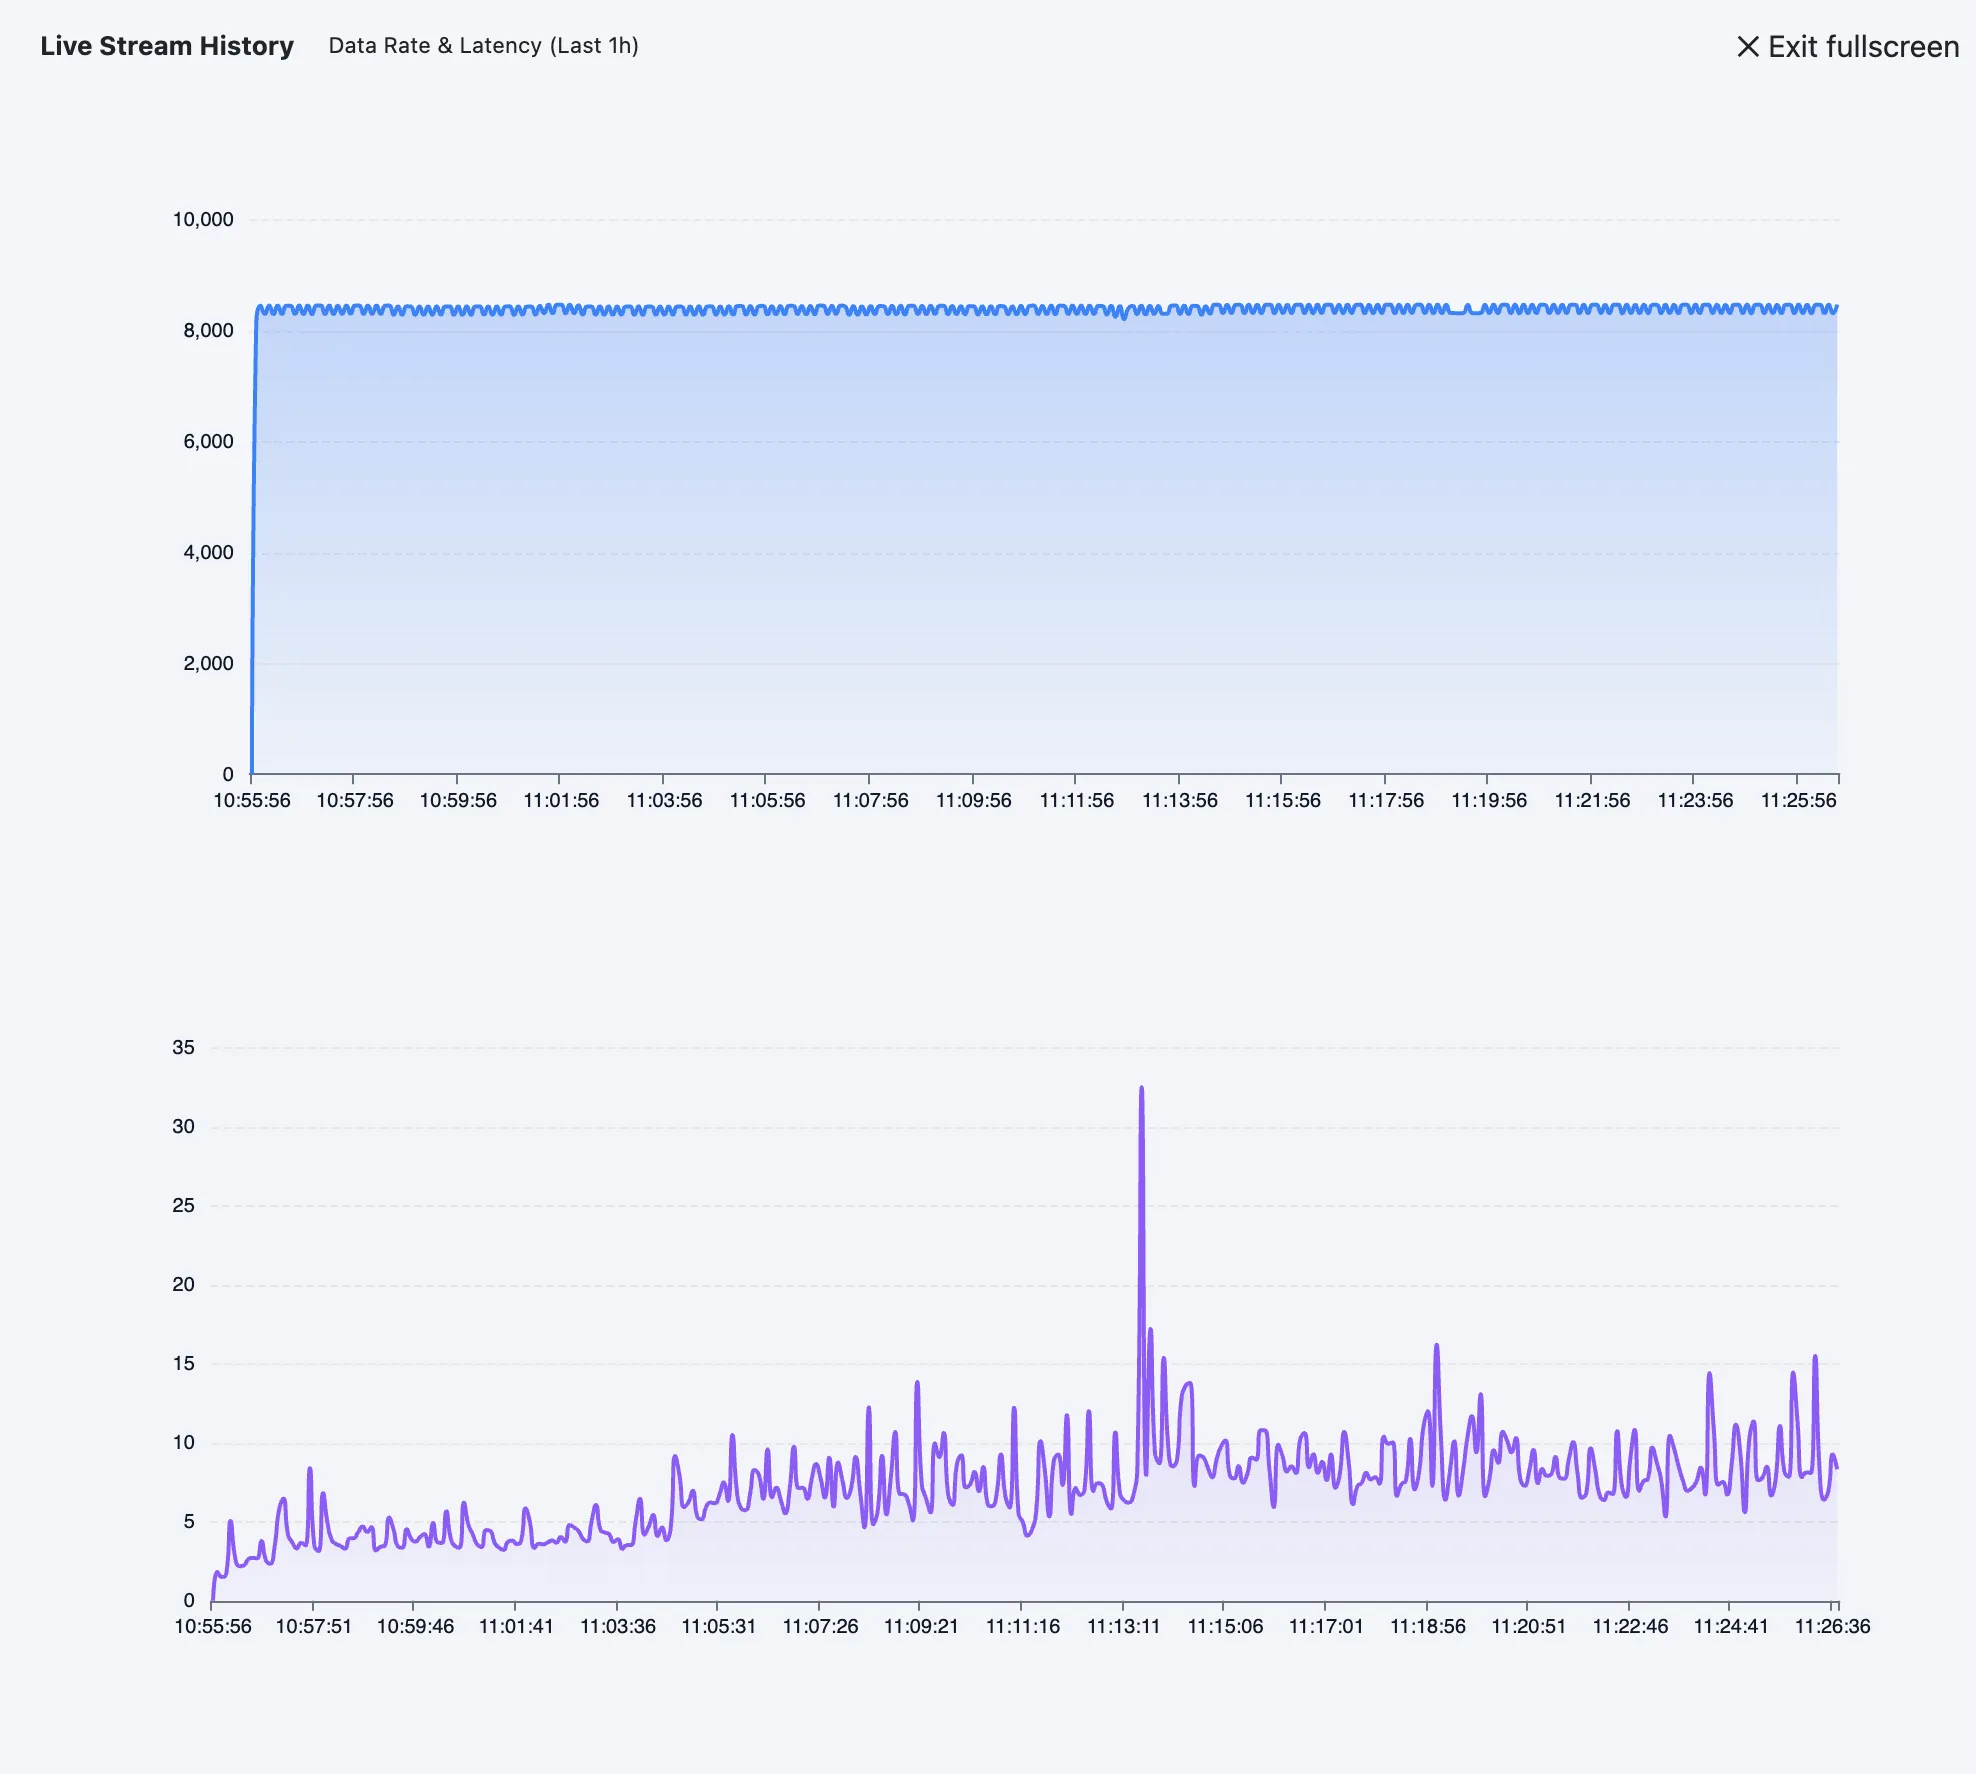
Live Stream & Trend Visibility
Live throughput + latency panel: Operational stream rate and latency are visible directly on the canvas.
Rolling trend context: Teams can compare current conditions against recent trend behavior without leaving the screen.
Live Stream & Trend Visibility
Gateway and Tag Activity Views
Gateway health focus: Connected edge state and load-related cues are shown to accelerate field diagnostics.
Recent tag activity ledger: Latest updates are surfaced in quality-prioritized order for operator follow-up.
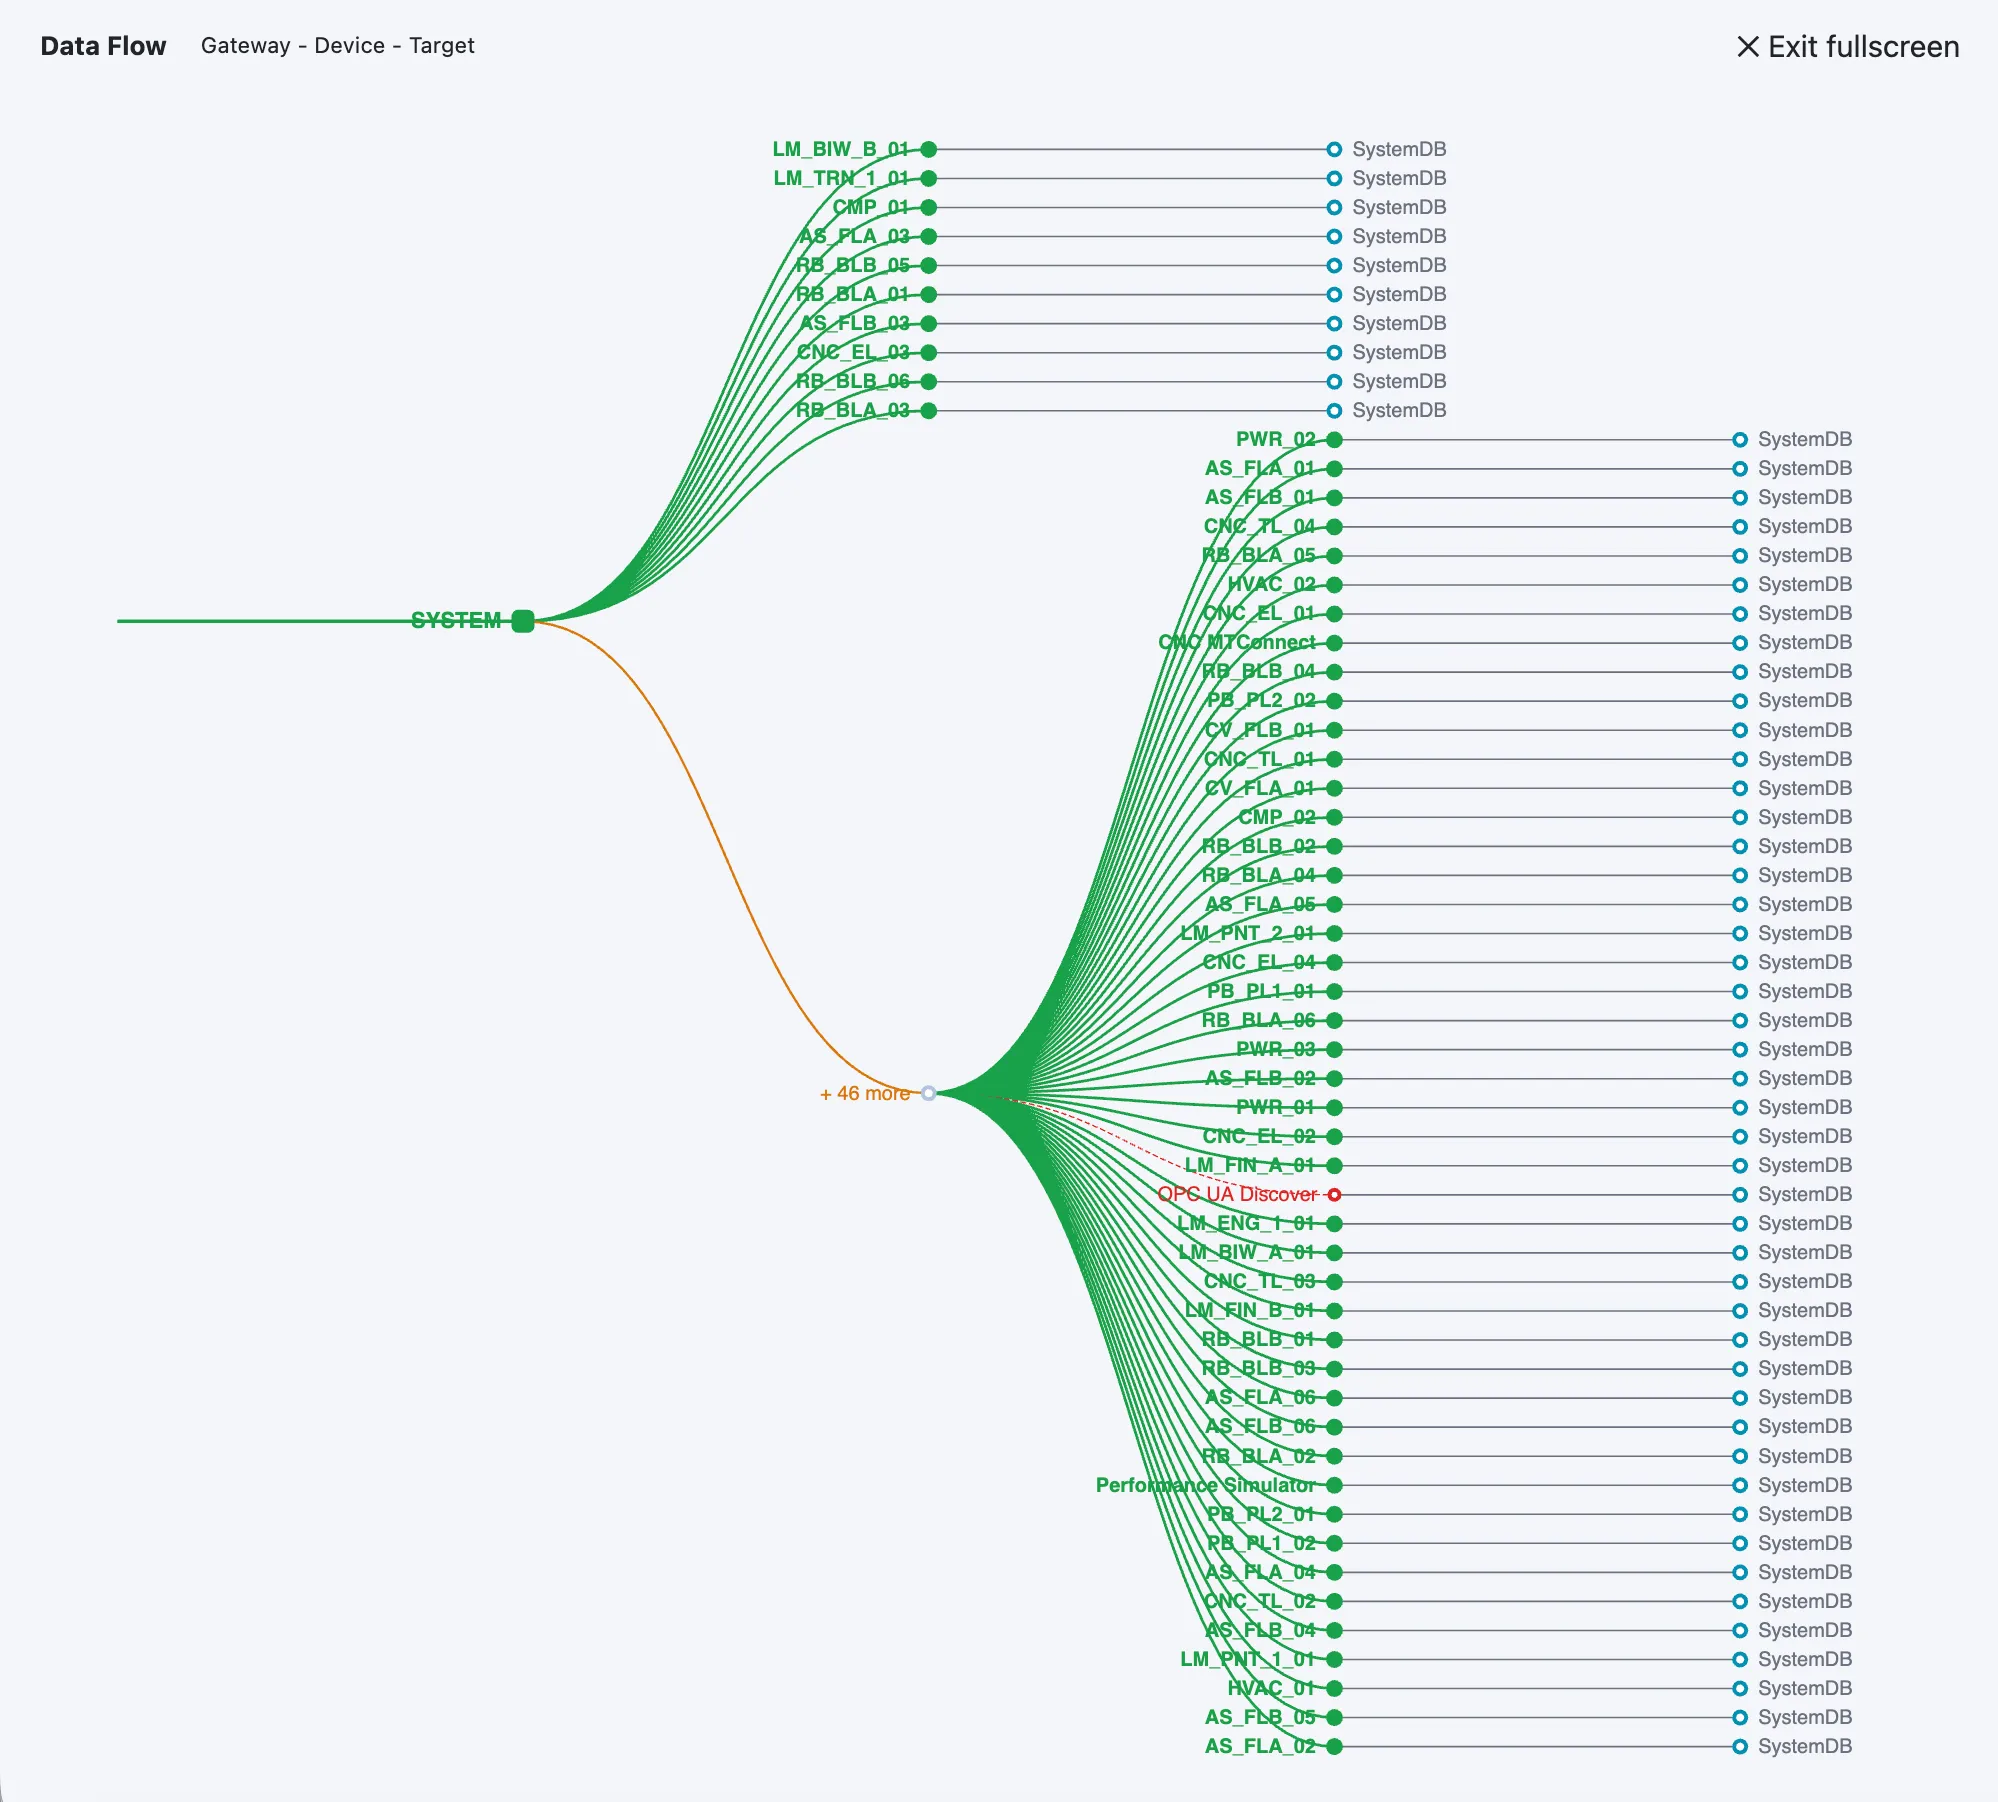
Data Flow topology view: Gateway -> device -> target relationships are visualized in a single operational graph.
Pipeline path clarity: Operators can validate where data is produced, how it is routed, and which outbound path is currently active.
Faster bottleneck isolation: Combined topology and freshness signals make it easier to identify where latency or delivery lag starts.
Gateway & Tag Activity Views
🔧 Improvements
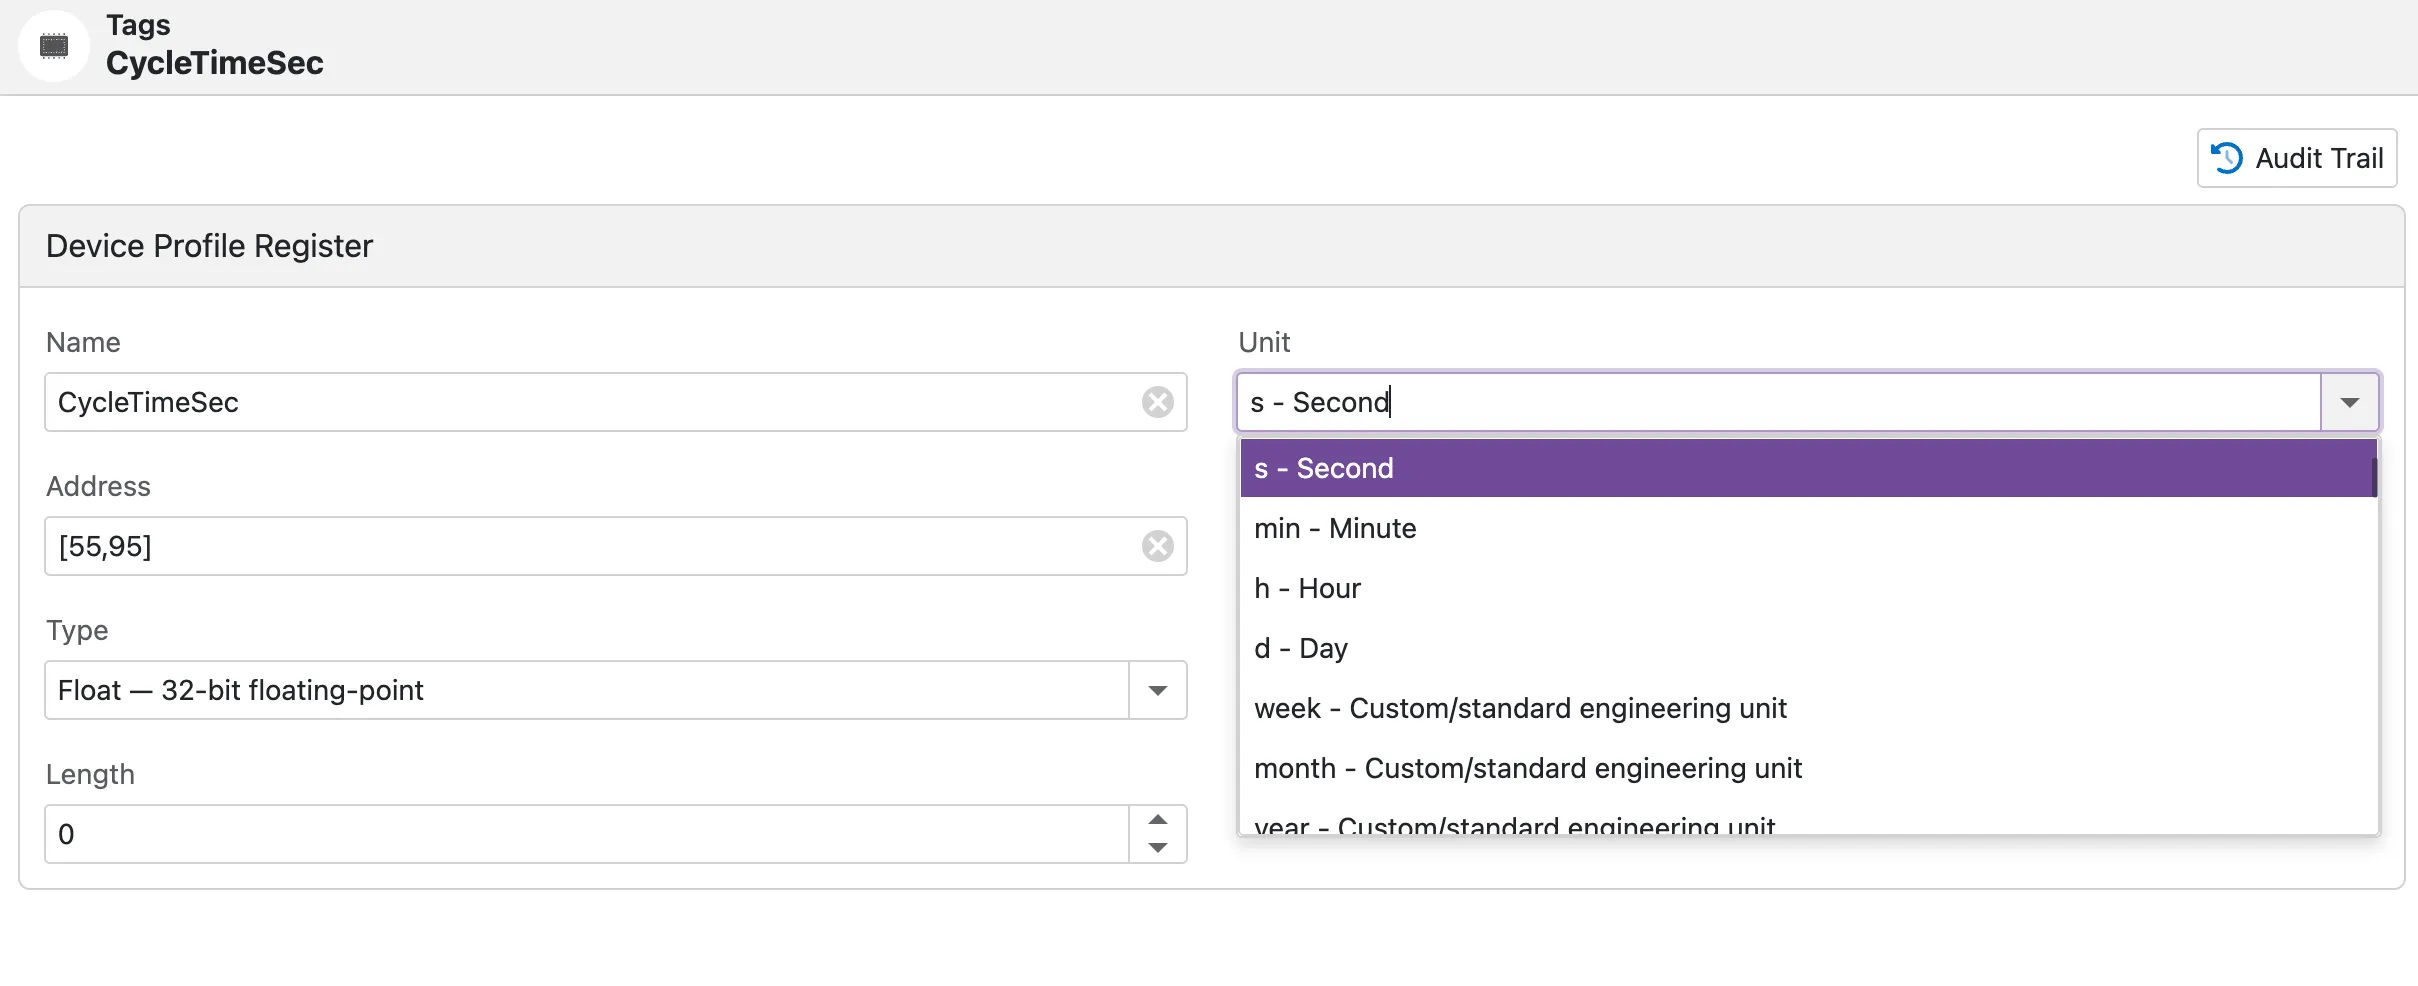
Unit Support Across Data Flow
Tag-level unit support: Tag definitions can include engineering units with standard or custom entries.
Payload + UNS visibility: Units are preserved across telemetry flow and shown together with live values.
Tag-Level Unit Support
📖 Documentation
Operations Center: Added/updated full operational guide for signal insights, KPI cards, data flow topology, incident timeline, and triage workflows.
MCP Server: Updated the AI agent integration guide with client compatibility notes for Codex, Qwen, Claude, and MCP Inspector; clarified call-time authentication and RBAC-governed data access behavior; documented the new MCP resources and prompts capabilities; and added guidance for canonical OData entity names, compatibility aliases, and live device status fields such as IsOnline and CurrentStatus.
🔗 Navigation Shortcuts
New top-right quick links: Two new shortcut icons were added to the top-right area.
Website shortcut: Direct access to https://proxus.io/.
Docs shortcut: Direct access to https://proxus.io/docs/.
We use essential cookies for our website to function properly and analytics cookies to improve your experience.
Read our Cookie Policy for more information.