
Proxus MCP Server gives compatible AI agents a governed way to understand and work with your industrial data platform. An agent can discover the live data model, read current device health, trace operational dependencies, investigate telemetry, and use approved entity operations without receiving direct database or control-system credentials.
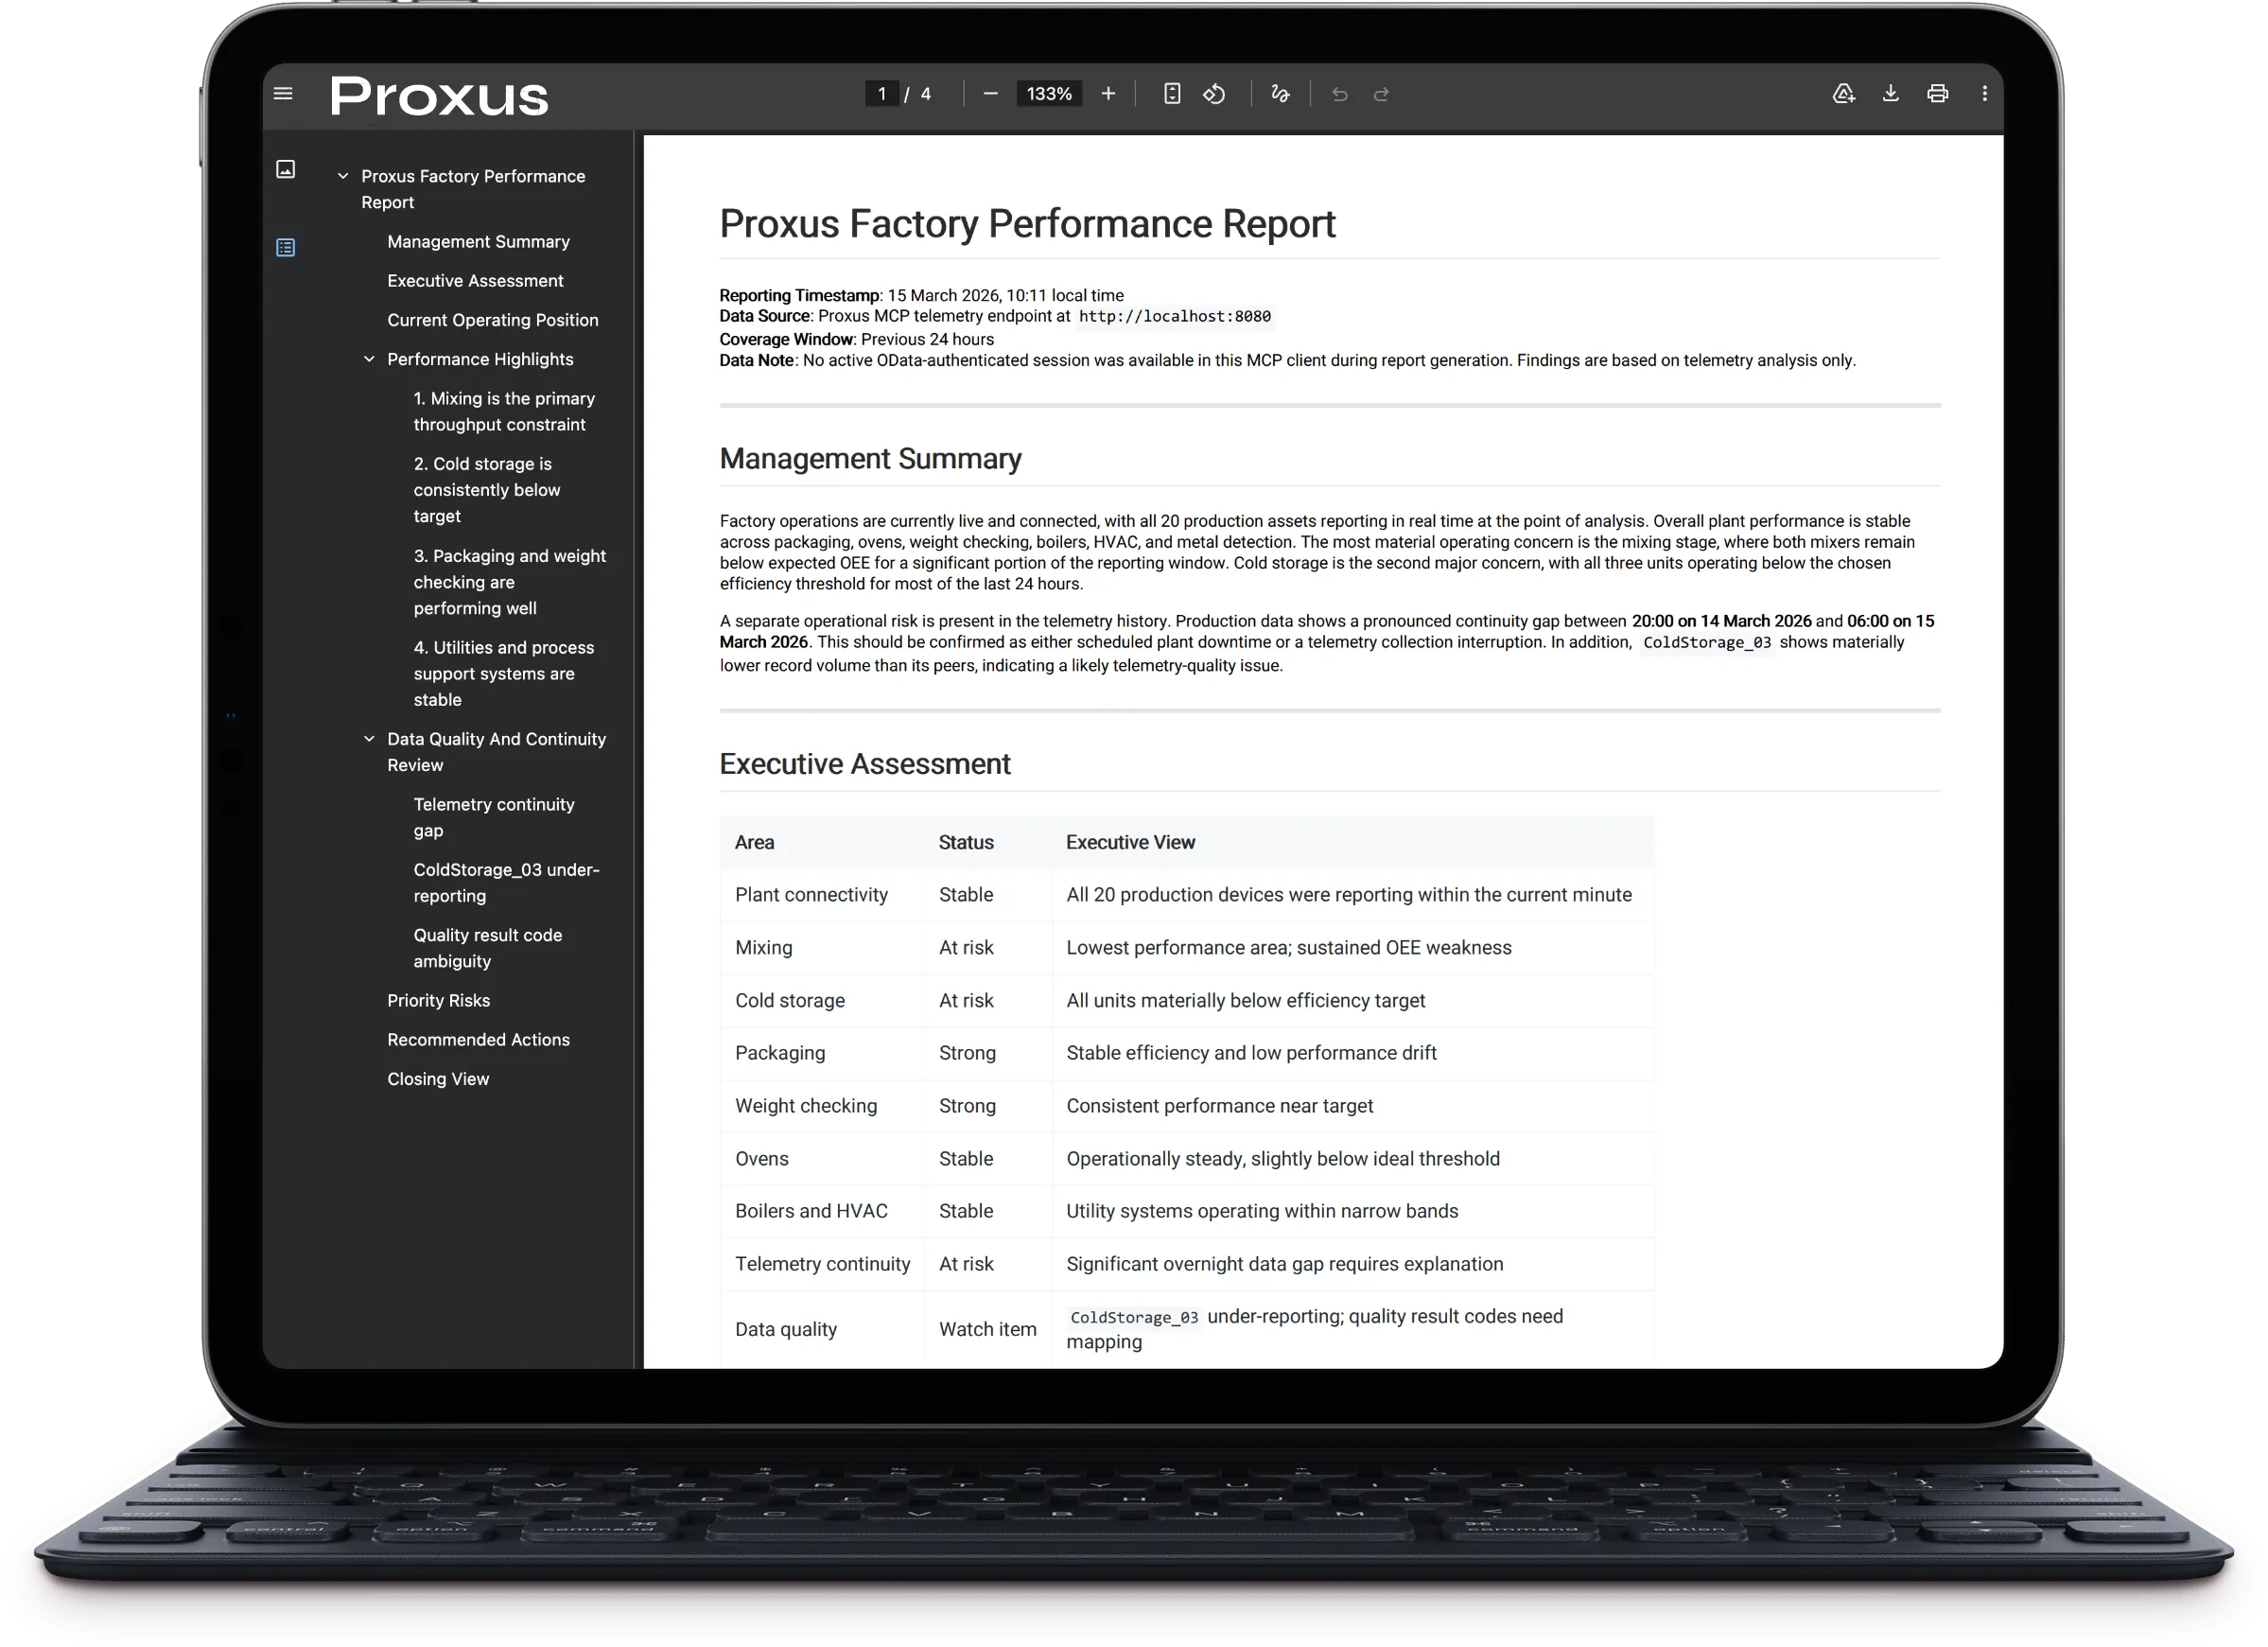
This page is for people connecting and using an AI agent. Platform owners should use MCP Server Administration for secure rollout, permissions, production endpoint preparation, limits, and audit operations.
Five-Minute Connection
1. Get the MCP endpoint
Use the Streamable HTTP endpoint exposed by your Proxus Hub:
https://your-proxus.example/mcpUse HTTPS outside local development. Do not add a second destination or pass a different server URL inside tool arguments.
2. Add Proxus to your agent
In your MCP-compatible client, add a remote server with:
| Setting | Value |
|---|---|
| Transport | Streamable HTTP |
| URL | Your Proxus /mcp endpoint |
| Authentication | Performed with the auth_login tool after connection |
Client configuration formats change over time. Use the current remote MCP server form supported by your client and point it to the endpoint above.
3. Let the agent discover the workflow
The first useful call is:
schema_overview()The response explains the authentication state, available data surfaces, safe operating rules, active tool catalog, and the correct tool for common tasks. An unfamiliar agent does not need a separate Proxus prompt before it starts.
4. Authenticate when requested
Before protected work, the agent should call:
auth_whoami()When authentication is required, the agent must stop and ask the human which Proxus account to use. It then calls:
auth_login(userName: "human-supplied-user", password: "human-supplied-password")Both properties are required. An empty password is valid only when the human explicitly confirms that the selected account has an empty password. After a successful protocol-bound login, the client reuses the same MCP transport session and does not manually pass session identifiers.
5. Ask an operational question
Examples:
Which devices can I see, and what is their current runtime health?
What Rules, Functions, and Dashboards depend on this tag?
What could be affected if DeviceProfile 54 changes?
Trace Alert 28 back to its telemetry evidence.
Find devices with telemetry continuity problems in the last 24 hours.
What the Agent Learns Automatically
Proxus teaches the connected agent through protocol-native surfaces rather than relying on a user-written master prompt.
| Surface | What it teaches |
|---|---|
| Server instructions | Authentication, read-only defaults, evidence boundaries, redaction, and safe recovery rules |
tools/list | Current tools, input schemas, required arguments, allowed values, and safety annotations |
schema_overview | Task-to-tool routing, active capabilities, session state, and catalog revision |
| Schema tools | Live entity fields, telemetry layout, templates, and protocol concepts |
| Structured diagnostics | Why a call failed and the deterministic next action |
Tool visibility is not permission. Protected tools can appear during discovery and still reject the call until the current Proxus user is authenticated and authorized.
Task Router
| User goal | Start with | Continue with |
|---|---|---|
| Understand what Proxus exposes | schema_overview | The recommended schema or task tool |
| Discover real entity names and fields | schema_entities | odata_request |
| Check current device health | device_status | A targeted graph or telemetry investigation when needed |
| Inspect immediate dependencies | graph_schema | graph_neighbors |
| Assess downstream change impact | graph_impact | graph_paths for a causal chain |
| Trace upstream causes | graph_lineage | graph_context_pack for compact AI context |
| Investigate telemetry | schema_telemetry | One or more bounded telemetry_query calls |
| Inspect recent operational logs | log_query | Narrower gateway and time filters |
| Read configuration or records | schema_entities | odata_request with explicit fields |
| Apply an explicitly requested change | Read the target first | odata_mutate, then verify with odata_request |
Keep Evidence Types Separate
An accurate agent must not collapse different kinds of truth into one status.
| Evidence | Correct source | What it means |
|---|---|---|
| Persisted configuration | odata_request | What is configured and enabled |
| Current device health | device_status | Runtime availability based on Hub evidence and freshness |
| Gateway connectivity | device_status and graph metadata | Whether the gateway runtime is currently connected |
| Desired deployment | Operational Graph | What the Hub intends the edge runtime to apply |
| Last-known edge confirmation | Operational Graph | Advisory evidence that a revision was applied |
| Telemetry observation | telemetry_query | What was measured during a defined time window |
AppliedByEdge or InSync does not prove that a device is currently online or producing data. Persisted Connected and Status fields are not a replacement for device_status.
Core Workflows
Current Device Inventory
1. auth_whoami()
2. device_status(maxDevices: 100)
3. Report Online, OfflineOrStale, Unknown, and Redacted separately
4. Include evaluatedAtUtc, freshness, omitted count, and configuration Enabled
Use exact deviceOids for a targeted check. Do not infer live connectivity from OData records.
Dependency and Impact Analysis
1. graph_schema()
2. graph_neighbors(entityType: "DeviceProfile", oid: "54", direction: "Both", depth: 1)
3. graph_impact(entityType: "DeviceProfile", oid: "54", depth: 2)
4. graph_paths(entityType: "DeviceProfile", oid: "54", direction: "Outgoing", goal: "maintenance change impact")
Graph direction is always upstream cause or source to downstream consumer or effect. Impact follows outgoing edges; lineage follows incoming edges.
Use the canonical entityType and oid argument names. key is not an alias for oid. Invalid arguments return tool_arguments_invalid with missing, unexpected, invalid, and accepted argument names so the agent can correct the same call without guessing.
Alarm to Telemetry Evidence
1. Use OData to select the Alert identifier and timestamp
2. graph_lineage(entityType: "Alert", oid: "28", depth: 4)
3. Identify the proven Rule, device, and telemetry key or series
4. schema_telemetry()
5. Query a narrow UTC window around the Alert time
6. Compare the measured value with the Alert evidence
Report whether each relationship comes from persisted configuration, desired runtime state, parsed semantics, or observed telemetry. Do not present a partial graph as proof that no other dependency exists.
Bounded Telemetry Investigation
telemetry_query is an administrator-only, guarded read surface. Call schema_telemetry before writing a query.
For predictable performance:
- Define the question first: freshness, gap, threshold, spike, trend, variance, or peer deviation.
- Constrain exact device identifiers, relevant telemetry keys, and a bounded UTC time window.
- Aggregate broad analysis before returning raw samples.
- Treat
LIMITas an output bound, not a scan bound. - On
query_resource_limit_exceeded, re-plan instead of repeating the same query. - Report coverage: devices, keys, time window, failed scopes, and remaining uncertainty.
Example:
SELECT
    DeviceId,
    Key,
    argMax(NumericValue, Time) AS LatestValue,
    max(Time) AS LastActivity
FROM DeviceRawData
PREWHERE DeviceId = 470
    AND Key = 'Temperature'
    AND Time >= now() - INTERVAL 1 HOUR
GROUP BY DeviceId, Key
LIMIT 10
The server accepts one guarded SELECT or SELECT-based CTE per call. One analysis may use multiple bounded calls.
Governed Entity Read
Discover the live contract before constructing OData:
1. schema_entities()
2. Choose a canonical entity and only its selectableFields
3. odata_request(path: "api/odata/Device?$select=Oid,DeviceName,Enabled&$top=20")
Entity reads require an explicit field projection. Unsupported navigation, broad expansion, restricted fields, and raw metadata access fail closed.
Explicit Change
MCP stays read-only unless the human requests a specific change. A safe write workflow is:
1. Confirm the exact target and requested outcome with the human
2. Read the current record
3. Check the active mutation capabilities in schema_overview
4. Call odata_mutate with one target, an allowed method, a minimal body, and truthful changeIntent
5. Read the target again and report the verified result
“Change something” is not sufficient authorization. Delete and bulk behavior remain separately controlled by the server configuration and user permissions.
Operational Graph Evidence
Every graph edge carries:
| Field | Meaning |
|---|---|
Relation | Stable relationship name |
SourceKindName | ConfigTyped, RuntimeDesired, ParsedCriteria, ParsedDashboard, RuntimeObserved, or ParsedFunction |
ConfidenceName | High, Medium, or Low |
Evidence | Sanitized explanation of why the edge exists |
ExtractorId | Stable, versioned origin identifier |
Numeric source-kind and confidence fields remain for compatibility. Use the name fields for human-readable agent responses and ExtractorId for integrations.
Check Diagnostics, Redactions, Limits, omitted counts, and Snapshot consistency before claiming completeness. Raw function code, credentials, connection parameters, notification secrets, and raw dashboard SQL are not returned.
Tool Catalog
| Group | Tools |
|---|---|
| Authentication | auth_login, auth_logout, auth_whoami |
| Runtime | device_status |
| Schema | schema_overview, schema_entities, schema_odata_metadata, schema_telemetry, schema_templates, schema_protocols |
| Graph | graph_schema, graph_neighbors, graph_impact, graph_lineage, graph_paths, graph_context_pack |
| Telemetry and logs | telemetry_query, log_query |
| Governed entities | odata_request, odata_mutate |
schema_odata_metadata and telemetry_query require an administrative Proxus role. Other protected tools use the permissions of the authenticated user and may filter or redact fields and objects.
Resources, Prompts, and Completions
Compatible clients can also use:
| Capability | Examples |
|---|---|
| Resources | Platform overview, entity schema, telemetry schema, entity templates, protocol definitions |
| Prompts | Safe entity read, controlled change, and telemetry analysis workflows |
| Completions | Allowed values for supported prompt and resource-template arguments |
These are optional accelerators. The server instructions, tool schemas, and schema_overview remain sufficient for a client that supports only tools.
Client and Catalog Notes
- Use a new MCP transport when changing server versions or testing tool discovery.
auth_loginrefreshes the Proxus business session; it does not refresh the client’s cached tool catalog.- If the client shows a retired tool or misses a tool named by
schema_overview, fully reconnect and refreshtools/list. - The server sends the standard tool-list change notification after initialization; the client must apply it.
- In the normal protocol-bound flow, no compatibility session identifier or cookie is required in tool arguments.
Recover from Structured Errors
| Classification | What to do |
|---|---|
authentication_required | Ask the human for the Proxus account and call auth_login |
authentication_input_required | Supply both human-provided login properties |
tool_arguments_invalid | Retry the named tool using requiredInputs and acceptedArguments |
tool_catalog_stale | Reconnect the MCP transport and refresh tools/list |
odata_select_required | Call schema_entities and rebuild a bounded projection |
query_resource_limit_exceeded | Re-plan the telemetry query; do not weaken limits or repeat it unchanged |
authorization_denied | Stop; the current Proxus role does not grant that operation |
endpoint_not_allowed or origin_not_allowed | Use the administrator-approved MCP endpoint |
graph_query_unavailable | Retry the same bounded graph query once, then report the diagnostic |
Never expose session identifiers, passwords, tokens, cookies, credentials, function code, connection parameters, or raw SQL in agent output.
Next Steps
- MCP Server Administration — production rollout, permissions, limits, and security operations
- Configuration Reference — canonical MCP settings and environment overrides
- Security and Users — platform roles and permissions
- UNS Topic Permissions — path-based UNS access
- REST API — direct application integration