v1.5.5: Live Device Detail Updates, Signal Trend Drill-Down & Clearer Alert Explanations
Device detail pages now refresh live runtime data automatically, add inline signal trend previews with fullscreen historical drill-down, and explain alert triggers with highlighted matched values.
Version 1.5.5 improves the device detail experience for operators who need faster signal visibility without manual refresh cycles.
✨ New Features
Live Device Detail Runtime
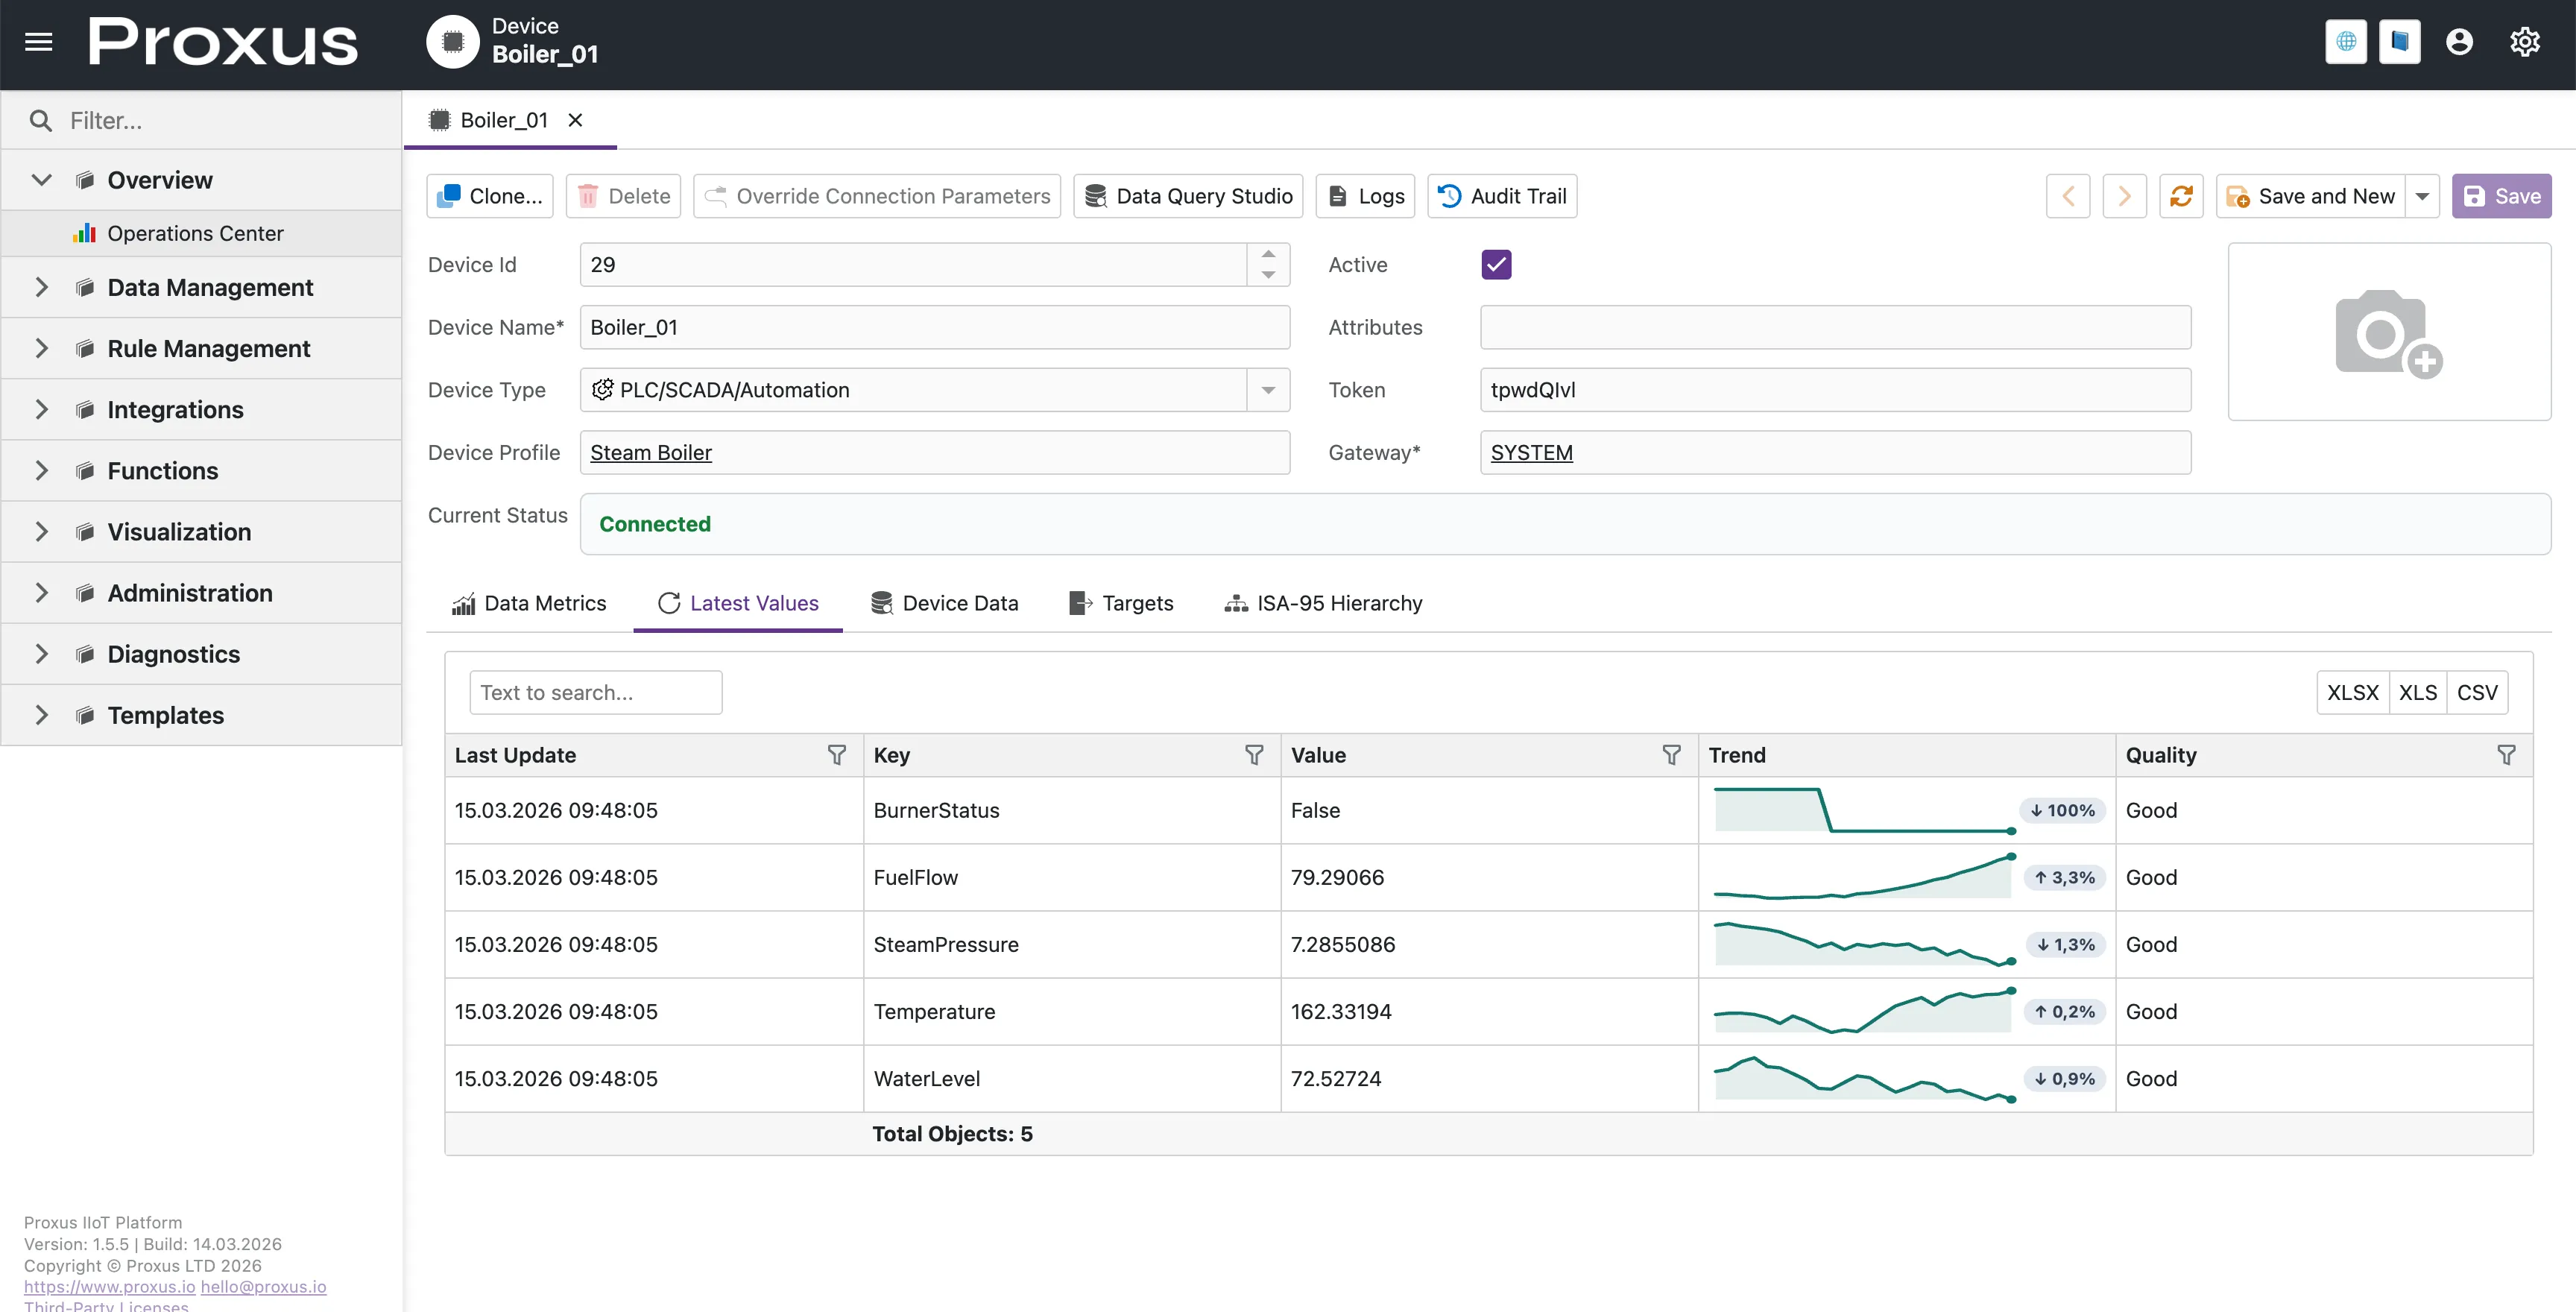
Automatic runtime updates: Device detail runtime sections now update automatically while the page stays open.
Live status visibility: Current device status refreshes in place without requiring a full page reload.
Faster operator feedback: Teams can watch current values, device data, and runtime metrics change as fresh telemetry arrives.
Inline Trend Preview
Signal trend sparkline: Latest Values now includes a compact trend preview for each signal directly in the grid.
Click-to-explore interaction: Selecting a signal opens a dedicated fullscreen trend view for deeper inspection.
Latest Values Live Trend Preview
Fullscreen Signal Trend View
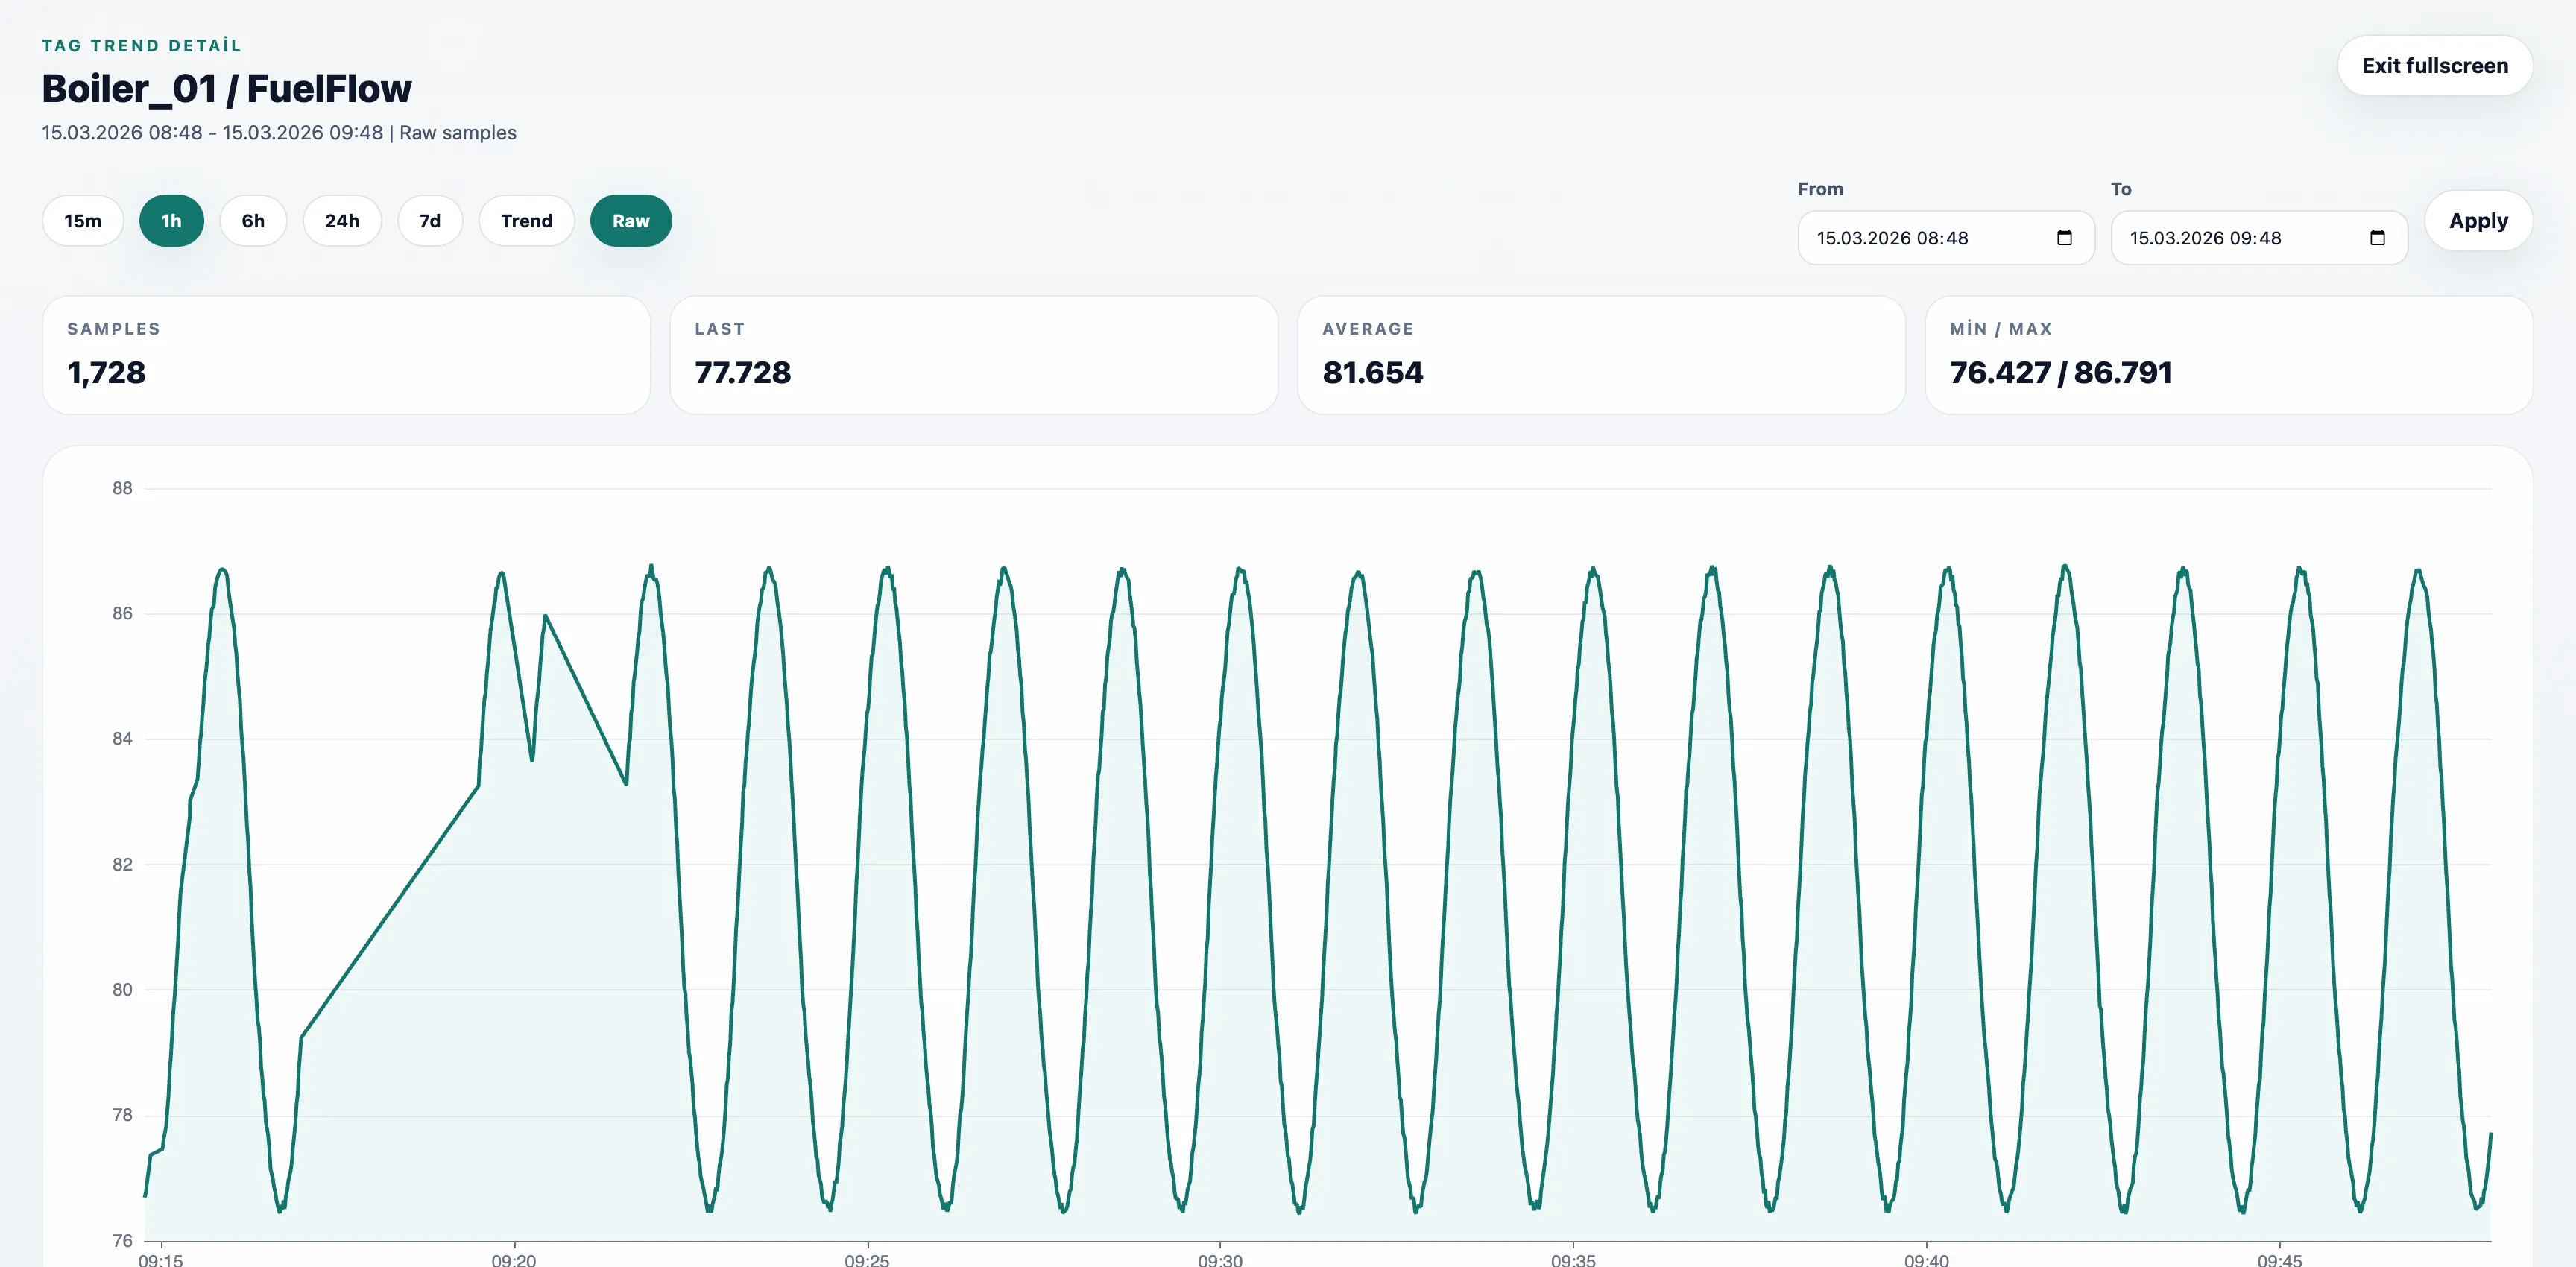
Historical trend analysis: Numeric signals open in a fullscreen chart with recent trend context.
Date range control: Operators can switch between quick ranges such as 15m, 1h, 6h, 24h, and 7d or apply a custom range.
Extended raw inspection window: Raw mode can now be used for up to 1 hour when operators need a closer look at short-interval signal behavior.
Quick statistics: Last value, average, min, max, and sample count are shown together with the chart.
Event fallback for non-numeric data: Text or state-based signals open as a time-ordered event history instead of an empty chart.
Fullscreen Raw Signal Trend View
🔧 Improvements
Latest Values Grid Usability
Cleaner toolbar layout: Search and export actions are grouped into a simpler single-row toolbar.
Header filtering support: Column-level filtering remains available from the grid headers.
Interaction cues: Trend previews now show pointer feedback to make drill-down affordance clearer.
Clearer Alert Explanations
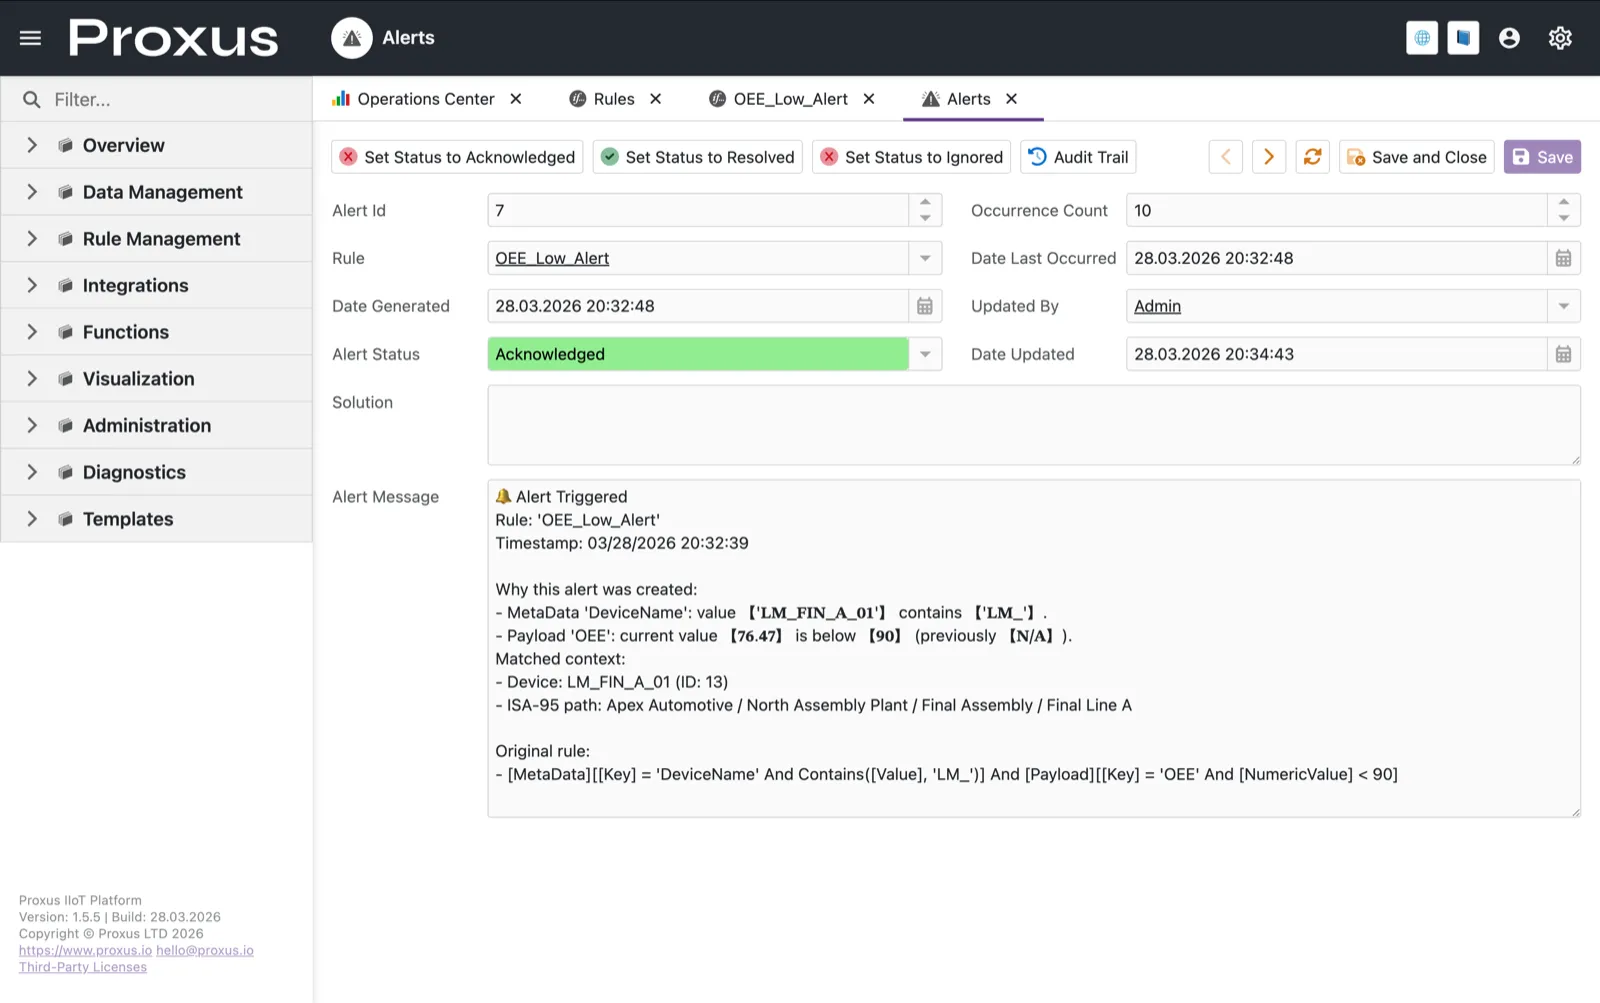
Direct trigger reasoning: Alert messages now explain which metadata, attribute, or payload condition matched instead of dumping full raw records.
Highlighted matched values: Device names, live values, thresholds, and previous values involved in the trigger are visually emphasized inside the alert detail message.
Faster operator triage: Teams can understand why an alert fired from the Alerts detail view without manually comparing every field in the record.
We use essential cookies for our website to function properly and analytics cookies to improve your experience.
Read our Cookie Policy for more information.