See Operations
in Real Time
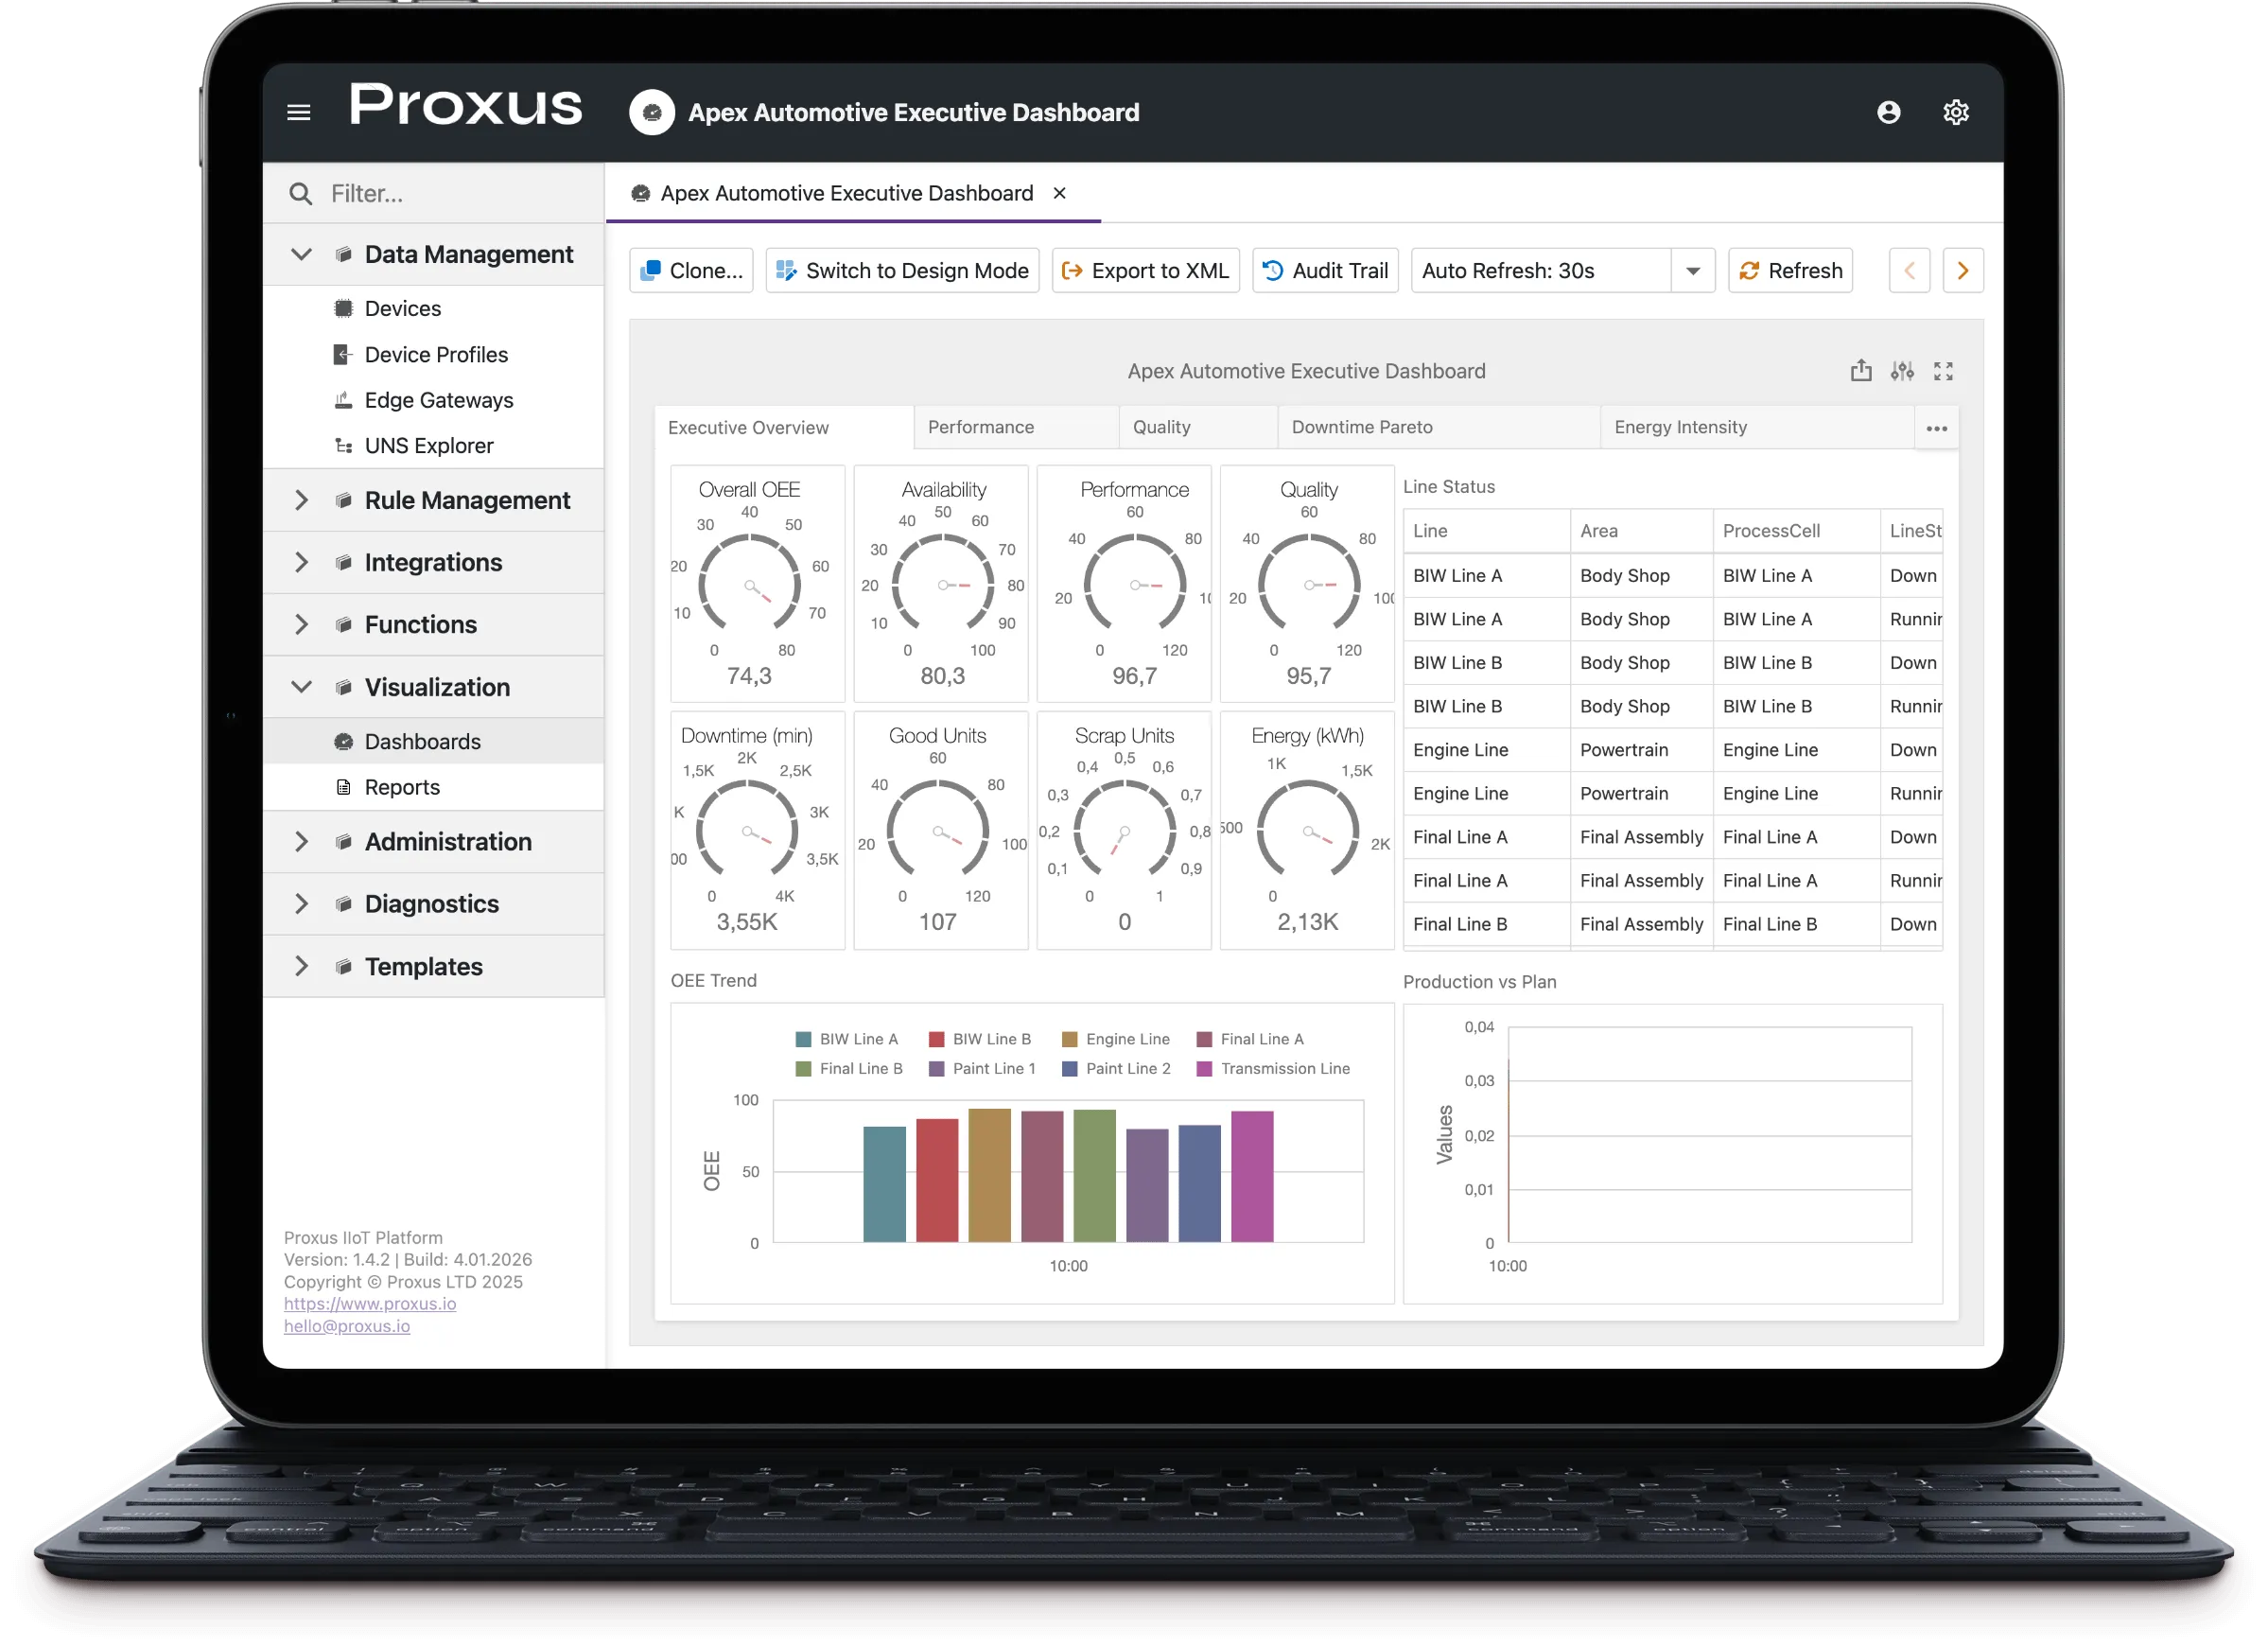
Turn unified operational data into live dashboards for operators, engineers, and leadership. Monitor KPIs, OEE, alarms, energy, and asset status from one trusted source.
Why Proxus Dashboards?
Dashboards are only as good as the data behind them. Proxus unifies plant data with a consistent tag model, then queries ClickHouse on a schedule for reliable, low-latency views. See how it works with the UNS.
- Scheduled refresh, dashboards update on configured intervals for dependable performance.
- Role-based views for operators, maintenance, quality, and management without duplicating tags.
- Live Stream option, use stream bindings when you need near-real-time updates.
- Governed access, topic-level scoping and read-only views keep critical controls safe.
What you can build
- Line/Cell HMIs with alarms and setpoint visibility
- OEE and downtime dashboards for shift leads
- Energy and utilities views (kWh, steam, water)
- Quality dashboards with SPC-style trends
- Executive scorecards with multi-site rollups
How it works with the UNS
Devices publish into the unified namespace. Proxus stores and queries the normalized data in ClickHouse, using a smart cache to reduce database load and keep refreshes fast. Explore the dashboard docs for layouts and widgets.
Example flow
- Devices and PLCs publish to UNS topics.
- Data is cached for fast reads and queried on a refresh schedule.
- Dashboards use ClickHouse queries or Live Stream bindings depending on the use case.
- Role-based layouts show the same truth with different slices.
- Exports and drill-downs reuse the same normalized tags.
Role-Based Experiences
Operators, maintenance, and leadership see the same truth with different lenses. Layouts and permissions align with roles, no duplicated dashboards to maintain. Review the FAQ for rollout guidance.
- Operators: shift boards, live alarms, setpoints, interlocks (read-only where needed).
- Maintenance: asset states, MTTR/MTBF, work orders, parts stock.
- Leadership: OEE, availability, quality, and energy KPIs across sites.
Mobile-ready
Dashboards adapt to tablets and phones for frontline teams. Responsive layouts and optimized refresh cycles keep operators in sync on the floor.
No extra mobile build, same UNS topics, same dashboard definitions.
Security and Governance
Access to dashboards follows the same guardrails as the data: topic-based permissions, read-only views for critical controls, and audit-friendly change history.
- Scoped access per role, line, and site.
- Read-only where required, no accidental writes to critical equipment.
- Traceability for alarm acknowledgements and change events.
What stays consistent
- Same UNS topics across dashboards and reports
- One cache for fast reads: no duplicate queries
- Role-based visibility without cloning dashboards
- Refresh intervals tuned to each team’s needs
FAQ
Common questions on latency, security, and multi-site rollout.
Dashboards refresh on a configurable interval. For near-real-time needs, use Live Stream bindings.
Yes. Dashboards run ClickHouse SQL queries and use a smart cache to reduce load.
Yes. Role-based permissions and read-only views prevent accidental writes to critical systems.
Dashboards show the latest available data; once connectivity returns, refresh resumes automatically.
Ready to see your plant in real time?
Build operator HMIs, shift boards, and executive scorecards on the same UNS. No polling, no duplicate models.