In Proxus, a Device is the digital representation of a physical asset. Configuring a device involves linking a communication template (Device Profile) to a physical connection point (Edge Gateway).
Core Configuration
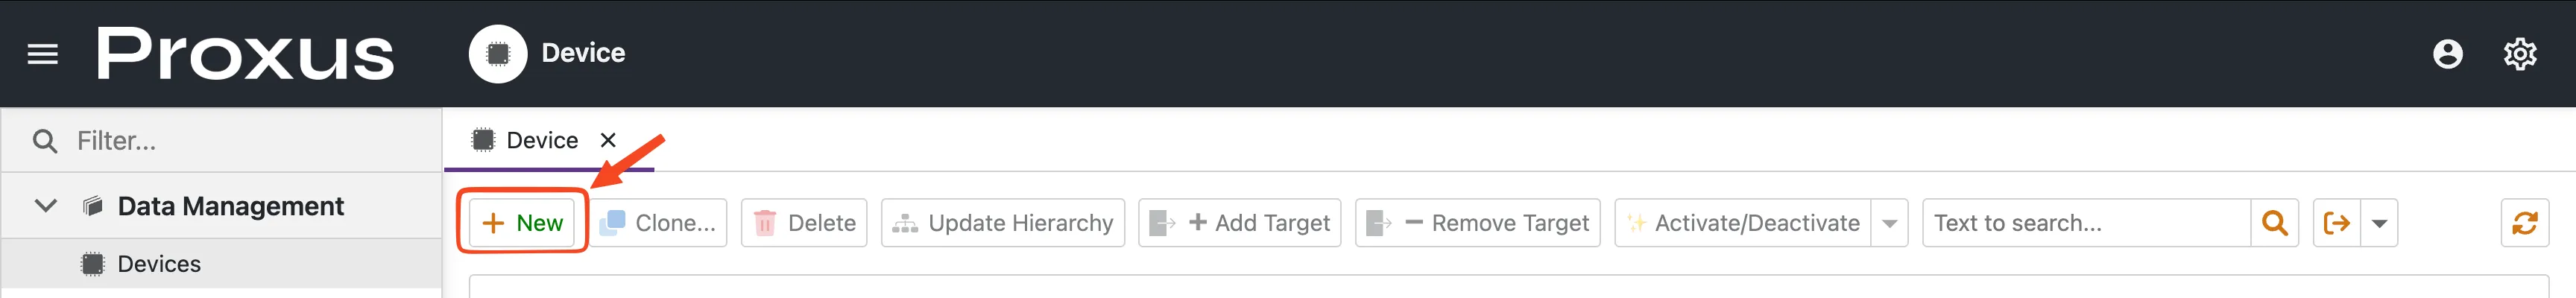
Navigate to Data Management > Devices and click New.
Identity & Type
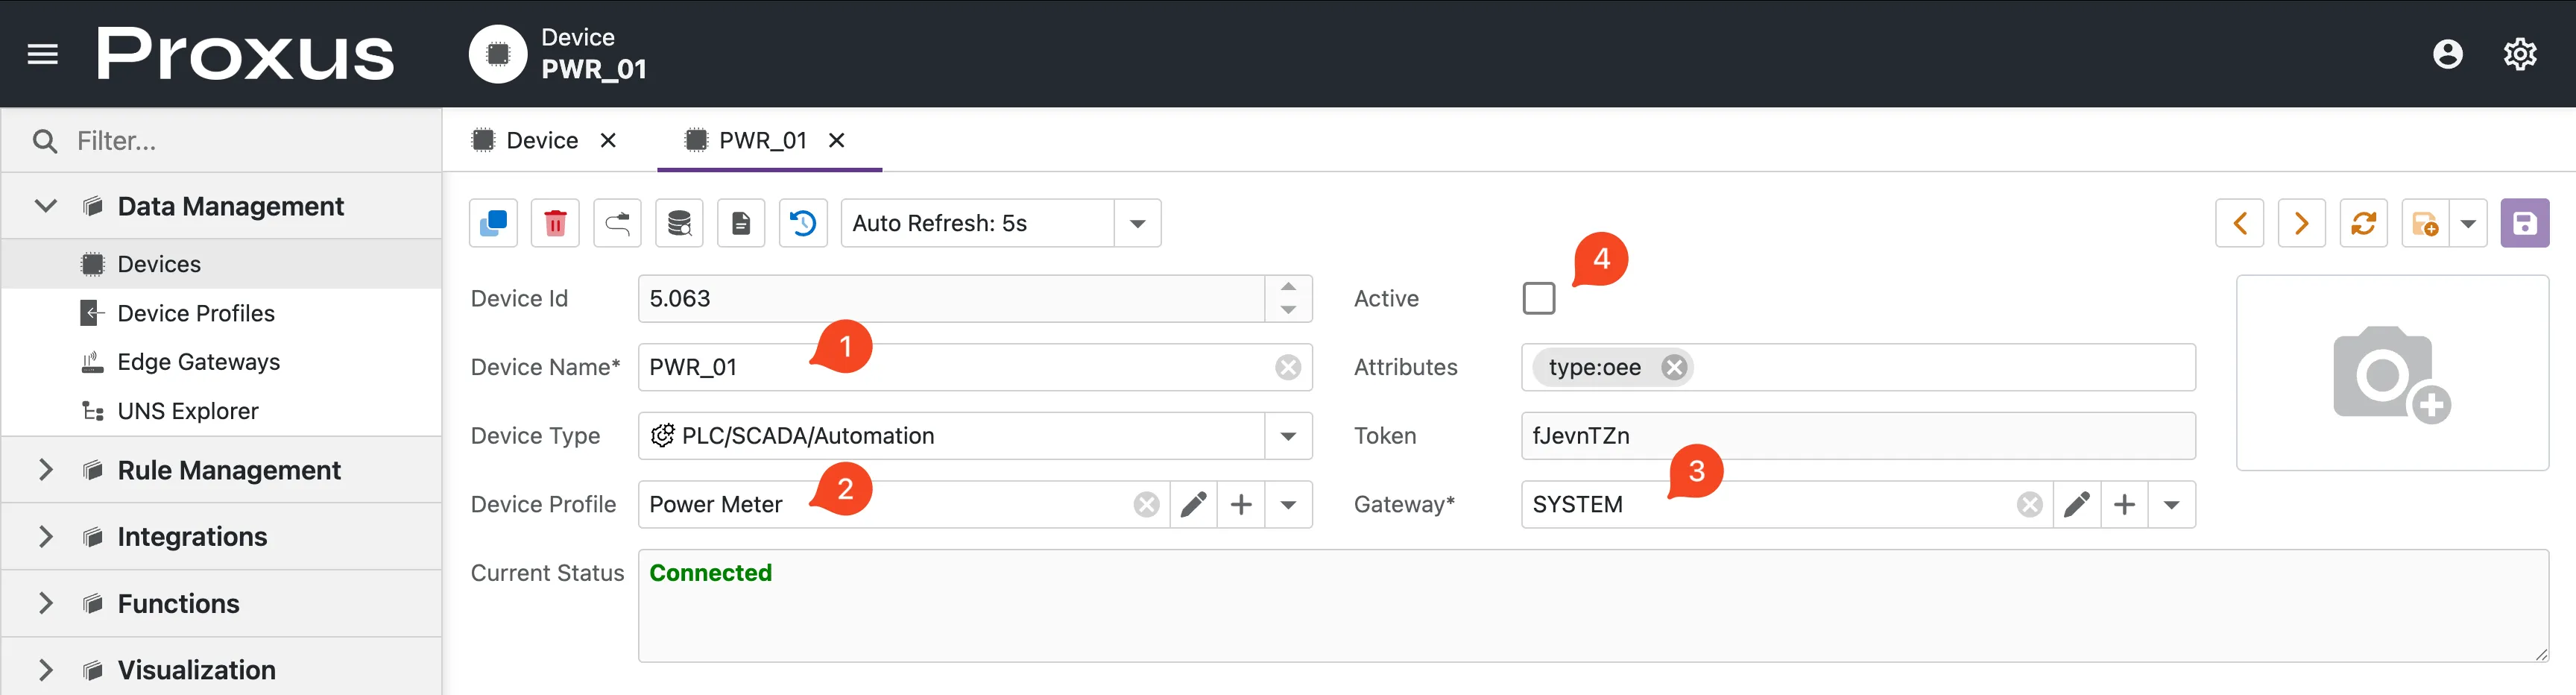
Device Name: A unique identifier for the asset (e.g.,
CNC-Lathe-01).warningUnique & ImmutableThe Device Name must be unique across the entire system and cannot be changed once created. It serves as the primary key for UNS Topic generation.
Device Type: Categorize your asset (e.g.,
PLC/SCADA,IoT Device).infoThis field is informational only. It helps with sorting and filtering in the UI but does not affect the communication protocol.
Device Profile: Select the Profile that defines the tags (Modbus registers, OPC nodes) and protocol settings. This is the "Driver" for your device.
Not sure which settings to use? Consult the Protocol Guides.
Connectivity
- Gateway: Choose the Edge Gateway that has physical network access to the asset. The configuration will be deployed to this specific node.
- Active (Checkbox): This is the master switch.
- Unchecked: Draft mode. No connection attempts.
- Checked: The system immediately pushes the config to the Edge Gateway, which begins polling data.
Every device is automatically assigned a secure Token. This is used for API authentication and identifying the device in the Unified Namespace.
Organizational Context (ISA-95)
To make your data queryable, you must define the device's location in the hierarchy. This structure drives the UNS Topic Hierarchy and Dashboard filtering.
- Enterprise: Organization name.
- Site: Physical location.
- Area: Production zone.
- Process Cell: Logical grouping.
Extended Metadata (Attributes)
The Attributes field accepts Key:Value pairs (e.g., serial:SN-1234 maintenance:2024-01-01) for custom metadata.
These attributes are powerful because they are:
- Attached to Data: Every telemetry packet includes these tags.
- Actionable: The Rule Engine can trigger logic based on them (e.g., "Alert on all devices where
type:Generator").
Next Steps
Once configured and Activated, the device will attempt to connect. Use the monitoring dashboard to verify the data flow:
Monitoring Device Details
View real-time connection status, health metrics, and raw data streams.