
Proxus IIoT platform provides an authenticated REST surface for platform entities, including devices, gateways, rules, alerts, and telemetry. The API uses OData for entity access and JWT bearer authentication. The live entity set and field contract is the OData metadata document, and authorization can further restrict what a user can read or change. For more information about authentication methods, see Authentication Providers.
Authentication
The API uses JWT Bearer Token authentication. To obtain a token:
- Send a POST request to the
/api/Authentication/Authenticateendpoint with your credentials. - Include the returned token in the
Authorizationheader of subsequent requests.
Client App
Your Code
Authenticate
/api/Authentication
OData API
Entity Operations
Platform
Devices / Rules / Alerts
The authentication endpoint returns the JWT token as a plain string (not a JSON object).
# Obtain token
curl -X POST https://<your-server-url>/api/Authentication/Authenticate \
  -H "Content-Type: application/json" \
  -d '{"userName": "<username>", "password": "<password>"}'

# Use token in subsequent requests
curl -X GET https://<your-server-url>/api/odata/Device \
  -H "Authorization: Bearer <jwt_token>"
OData Endpoints
The Proxus API uses OData for the entity sets exposed by the current server. Base URL: https://<your-server-url>/api/odata. Read the live contract at GET /api/odata/$metadata; use the fields and entity sets available to the authenticated user rather than assuming every platform object is exposed.
Core Entities
| Entity | Methods | Description |
|---|---|---|
Device | As permitted by the live contract and user permissions | Manage industrial devices and their configurations. |
Gateway | As permitted by the live contract and user permissions | Manage edge computing gateways. |
Alert | As permitted by the live contract and user permissions | Access and manage system alerts. |
Rule | As permitted by the live contract and user permissions | Configure and manage rule engine rules. |
RuleAction | As permitted by the live contract and user permissions | Define actions for rules. |
TargetProfile | As permitted by the live contract and user permissions | Configure target system profiles (MSSQL, PostgreSQL, ClickHouse, etc.). |
DeviceProfile | As permitted by the live contract and user permissions | Manage device communication profiles. |
NotificationChannel | As permitted by the live contract and user permissions | Configure notification channels. |
Note: Telemetry (
DeviceRawData) is not exposed via OData. Use the Telemetry API for SELECT queries. For more information about the telemetry storage system, see ClickHouse Integration.
Supported OData Operations
Entity endpoints support the OData query options enabled by the server and allowed for the current request:
$filter: Filter results (e.g.,/api/odata/Device?$filter=Name eq 'MyDevice')$select: Select specific fields (e.g.,/api/odata/Device?$select=Name,Status)$top&$skip: Pagination (e.g.,/api/odata/Device?$top=10&$skip=20)$orderby: Sort results (e.g.,/api/odata/Device?$orderby=Name)$count: Get total count (e.g.,/api/odata/Device/$count)
The server caps the page size at 100 records for a single OData query. Prefer an explicit $select, a bounded $top, and pagination. A successful read does not imply that the same identity is allowed to create, update, or delete the entity.
Telemetry API
For direct access to telemetry data stored in ClickHouse, use the dedicated telemetry endpoint:
Execute Telemetry Query
- Endpoint:
POST /api/Telemetry/execute - Description: Execute secure SELECT queries against ClickHouse telemetry data
- Request Body:
{ "query": "SELECT * FROM DeviceRawData WHERE Time > now() - INTERVAL 1 DAY LIMIT 100" } - Query Parameters:
maxRows: Maximum number of rows to return (default: 10000, max: 50000)
This endpoint includes SQL injection protection and enforces query limits (SELECT-only).
Response Format: ClickHouse returns JSONEachRow (NDJSON). Clients should read the response body as text or stream it line-by-line. For more information about the data structure and how it relates to the Unified Namespace, see Unified Namespace.
Swagger Documentation
For an interactive explorer of all available endpoints and schemas, access the Swagger UI on your local installation:
http://<your-server-url>/swagger
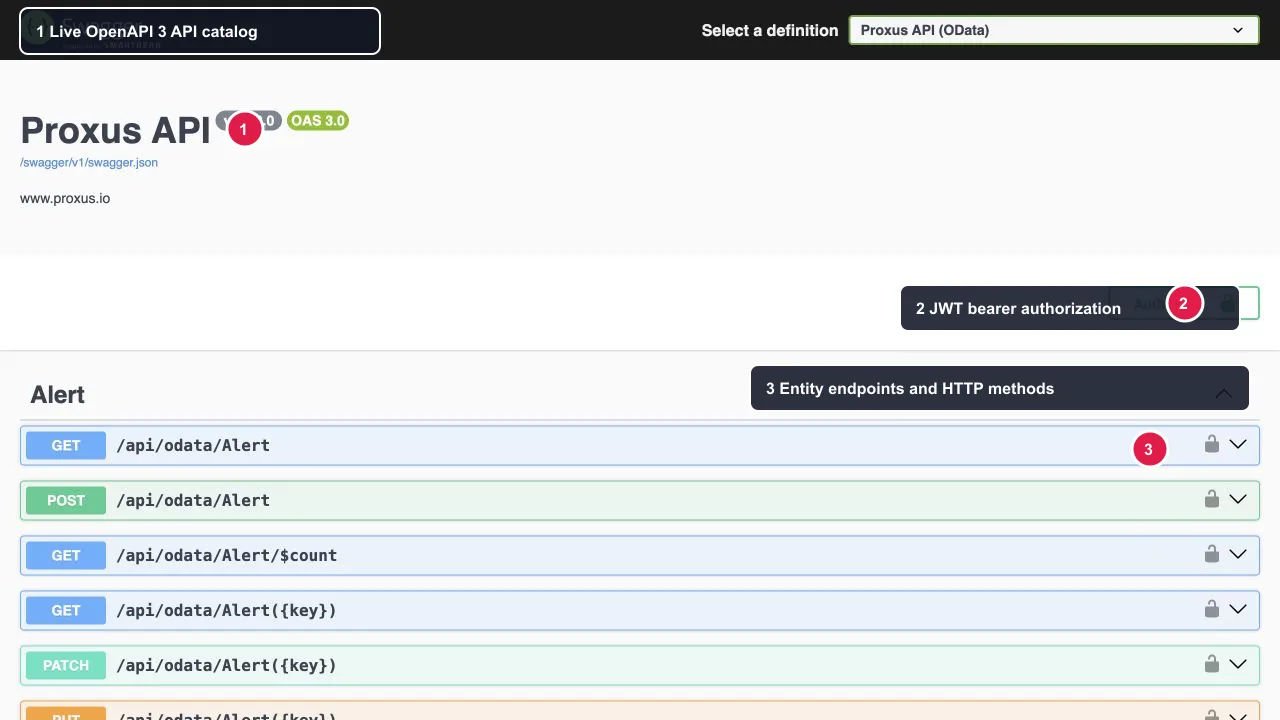
The live demo was verified against the generated OpenAPI 3 document. The screen exposes the current API catalog, the JWT bearer Authorize control, and the entity operations published by the running server. The endpoint list can change with the server version and installed modules, so use the generated document as the final contract.
The Swagger UI provides:
- Interactive endpoint testing
- Request/response schema definitions
- Generated request and response schemas, with examples where the running contract provides them
- JWT bearer authentication support through the
Authorization: Bearer <token>header
Code Examples
Here are examples of how to interact with the Proxus API using different programming languages:
Authentication
# Get JWT token
curl -X POST https://<your-server-url>/api/Authentication/Authenticate \
  -H "Content-Type: application/json" \
  -d '{"userName": "<username>", "password": "<password>"}'
Get Devices
# List all devices
curl -X GET https://<your-server-url>/api/odata/Device \
  -H "Authorization: Bearer <jwt_token>" \
  -H "Content-Type: application/json"
Get Gateways
# List all gateways
curl -X GET https://<your-server-url>/api/odata/Gateway \
  -H "Authorization: Bearer <jwt_token>" \
  -H "Content-Type: application/json"
Create Device
# Create a new device
curl -X POST https://<your-server-url>/api/odata/Device \
  -H "Authorization: Bearer <jwt_token>" \
  -H "Content-Type: application/json" \
  -d '{
    "deviceName": "Example Device",
    "enabled": true,
    "status": "Active"
  }'
Create Gateway
# Create a new gateway
curl -X POST https://<your-server-url>/api/odata/Gateway \
  -H "Authorization: Bearer <jwt_token>" \
  -H "Content-Type: application/json" \
  -d '{
    "name": "Example Gateway",
    "status": "Active"
  }'
Query Telemetry Data
# Execute a telemetry query
curl -X POST https://<your-server-url>/api/Telemetry/execute \
  -H "Authorization: Bearer <jwt_token>" \
  -H "Content-Type: application/json" \
  -d '{
    "query": "SELECT * FROM DeviceRawData WHERE Time > now() - INTERVAL 1 DAY LIMIT 100"
  }'
Authentication
// Get JWT token
const authResponse = await fetch('https://<your-server-url>/api/Authentication/Authenticate', {
  method: 'POST',
  headers: {
    'Content-Type': 'application/json',
  },
  body: JSON.stringify({
    userName: '<username>',
    password: '<password>'
  })
});

const token = (await authResponse.text()).replace(/"/g, "");
Get Devices
// List all devices
const devicesResponse = await fetch('https://<your-server-url>/api/odata/Device', {
  method: 'GET',
  headers: {
    'Authorization': `Bearer ${token}`,
    'Content-Type': 'application/json'
  }
});

const devices = await devicesResponse.json();
Get Gateways
// List all gateways
const gatewaysResponse = await fetch('https://<your-server-url>/api/odata/Gateway', {
  method: 'GET',
  headers: {
    'Authorization': `Bearer ${token}`,
    'Content-Type': 'application/json'
  }
});

const gateways = await gatewaysResponse.json();
Create Device
// Create a new device
const createResponse = await fetch('https://<your-server-url>/api/odata/Device', {
  method: 'POST',
  headers: {
    'Authorization': `Bearer ${token}`,
    'Content-Type': 'application/json'
  },
  body: JSON.stringify({
    deviceName: "Example Device",
    enabled: true,
    status: "Active"
  })
});
Create Gateway
// Create a new gateway
const createGatewayResponse = await fetch('https://<your-server-url>/api/odata/Gateway', {
  method: 'POST',
  headers: {
    'Authorization': `Bearer ${token}`,
    'Content-Type': 'application/json'
  },
  body: JSON.stringify({
    name: "Example Gateway",
    status: "Active"
  })
});
Query Telemetry Data
// Execute a telemetry query
const telemetryResponse = await fetch('https://<your-server-url>/api/Telemetry/execute', {
  method: 'POST',
  headers: {
    'Authorization': `Bearer ${token}`,
    'Content-Type': 'application/json'
  },
  body: JSON.stringify({
    query: "SELECT * FROM DeviceRawData WHERE Time > now() - INTERVAL 1 DAY LIMIT 100"
  })
});

const telemetryText = await telemetryResponse.text(); // NDJSON (JSONEachRow)
Authentication
import requests
import json

# Get JWT token
auth_url = "https://<your-server-url>/api/Authentication/Authenticate"
auth_payload = {
    "userName": "<username>",
    "password": "<password>"
}

auth_response = requests.post(auth_url, json=auth_payload)
token = auth_response.text.strip('"')
Get Devices
# List all devices
devices_url = "https://<your-server-url>/api/odata/Device"
headers = {
    "Authorization": f"Bearer {token}",
    "Content-Type": "application/json"
}

devices_response = requests.get(devices_url, headers=headers)
devices = devices_response.json()
Get Gateways
# List all gateways
gateways_url = "https://<your-server-url>/api/odata/Gateway"
gateways_response = requests.get(gateways_url, headers=headers)
gateways = gateways_response.json()
Create Device
# Create a new device
create_url = "https://<your-server-url>/api/odata/Device"
device_payload = {
    "deviceName": "Example Device",
    "enabled": True,
    "status": "Active"
}

create_response = requests.post(create_url, json=device_payload, headers=headers)
Create Gateway
# Create a new gateway
gateway_url = "https://<your-server-url>/api/odata/Gateway"
gateway_payload = {
    "name": "Example Gateway",
    "status": "Active"
}

gateway_response = requests.post(gateway_url, json=gateway_payload, headers=headers)
Query Telemetry Data
# Execute a telemetry query
telemetry_url = "https://<your-server-url>/api/Telemetry/execute"
telemetry_payload = {
    "query": "SELECT * FROM DeviceRawData WHERE Time > now() - INTERVAL 1 DAY LIMIT 100"
}

telemetry_response = requests.post(telemetry_url, json=telemetry_payload, headers=headers)
telemetry_data = telemetry_response.text  # NDJSON (JSONEachRow)
Authentication
using System;
using System.Net.Http;
using System.Text;
using System.Threading.Tasks;
using Newtonsoft.Json;

// Get JWT token
using var client = new HttpClient();
var authPayload = new {
    userName = "<username>",
    password = "<password>"
};

var json = JsonConvert.SerializeObject(authPayload);
var content = new StringContent(json, Encoding.UTF8, "application/json");
var authResponse = await client.PostAsync("https://<your-server-url>/api/Authentication/Authenticate", content);

var authToken = await authResponse.Content.ReadAsStringAsync();
string token = authToken.Trim().Trim('"');
Get Devices
// List all devices
client.DefaultRequestHeaders.Authorization =
    new System.Net.Http.Headers.AuthenticationHeaderValue("Bearer", token);

var devicesResponse = await client.GetAsync("https://<your-server-url>/api/odata/Device");
var devicesJson = await devicesResponse.Content.ReadAsStringAsync();
dynamic devices = JsonConvert.DeserializeObject(devicesJson);
Get Gateways
// List all gateways
var gatewaysResponse = await client.GetAsync("https://<your-server-url>/api/odata/Gateway");
var gatewaysJson = await gatewaysResponse.Content.ReadAsStringAsync();
dynamic gateways = JsonConvert.DeserializeObject(gatewaysJson);
Create Device
// Create a new device
var devicePayload = new {
    deviceName = "Example Device",
    enabled = true,
    status = "Active"
};

var deviceJson = JsonConvert.SerializeObject(devicePayload);
var deviceContent = new StringContent(deviceJson, Encoding.UTF8, "application/json");

var createResponse = await client.PostAsync("https://<your-server-url>/api/odata/Device", deviceContent);
Create Gateway
// Create a new gateway
var gatewayPayload = new {
    name = "Example Gateway",
    status = "Active"
};

var gatewayJson = JsonConvert.SerializeObject(gatewayPayload);
var gatewayContent = new StringContent(gatewayJson, Encoding.UTF8, "application/json");

var gatewayResponse = await client.PostAsync("https://<your-server-url>/api/odata/Gateway", gatewayContent);
Query Telemetry Data
// Execute a telemetry query
var telemetryPayload = new {
    query = "SELECT * FROM DeviceRawData WHERE Time > now() - INTERVAL 1 DAY LIMIT 100"
};

var telemetryJson = JsonConvert.SerializeObject(telemetryPayload);
var telemetryContent = new StringContent(telemetryJson, Encoding.UTF8, "application/json");

var telemetryResponse = await client.PostAsync("https://<your-server-url>/api/Telemetry/execute", telemetryContent);
var telemetryData = await telemetryResponse.Content.ReadAsStringAsync();Configure JWT token signing keys, expiration, and issuer/audience claims via the JWT & WebAPI section in Proxus-config.toml.