Use the Data Query Studio when you need to ask a question about past data without building a full dashboard first. It gives you direct, safe access to history, export, and quick analysis.
It sits between raw database access and visual dashboards, so you can explore data without writing complex code.
Why Use Data Query Studio?
- Troubleshooting: Look at the last hour of data for a machine to see what happened before a failure.
- Ad-Hoc Reporting: Build a dataset for a specific time range and export it to Excel for offline analysis.
- Dashboard Prototyping: Try a data view, then turn it into a dashboard when it is useful.
Getting Started
Accessing the Studio
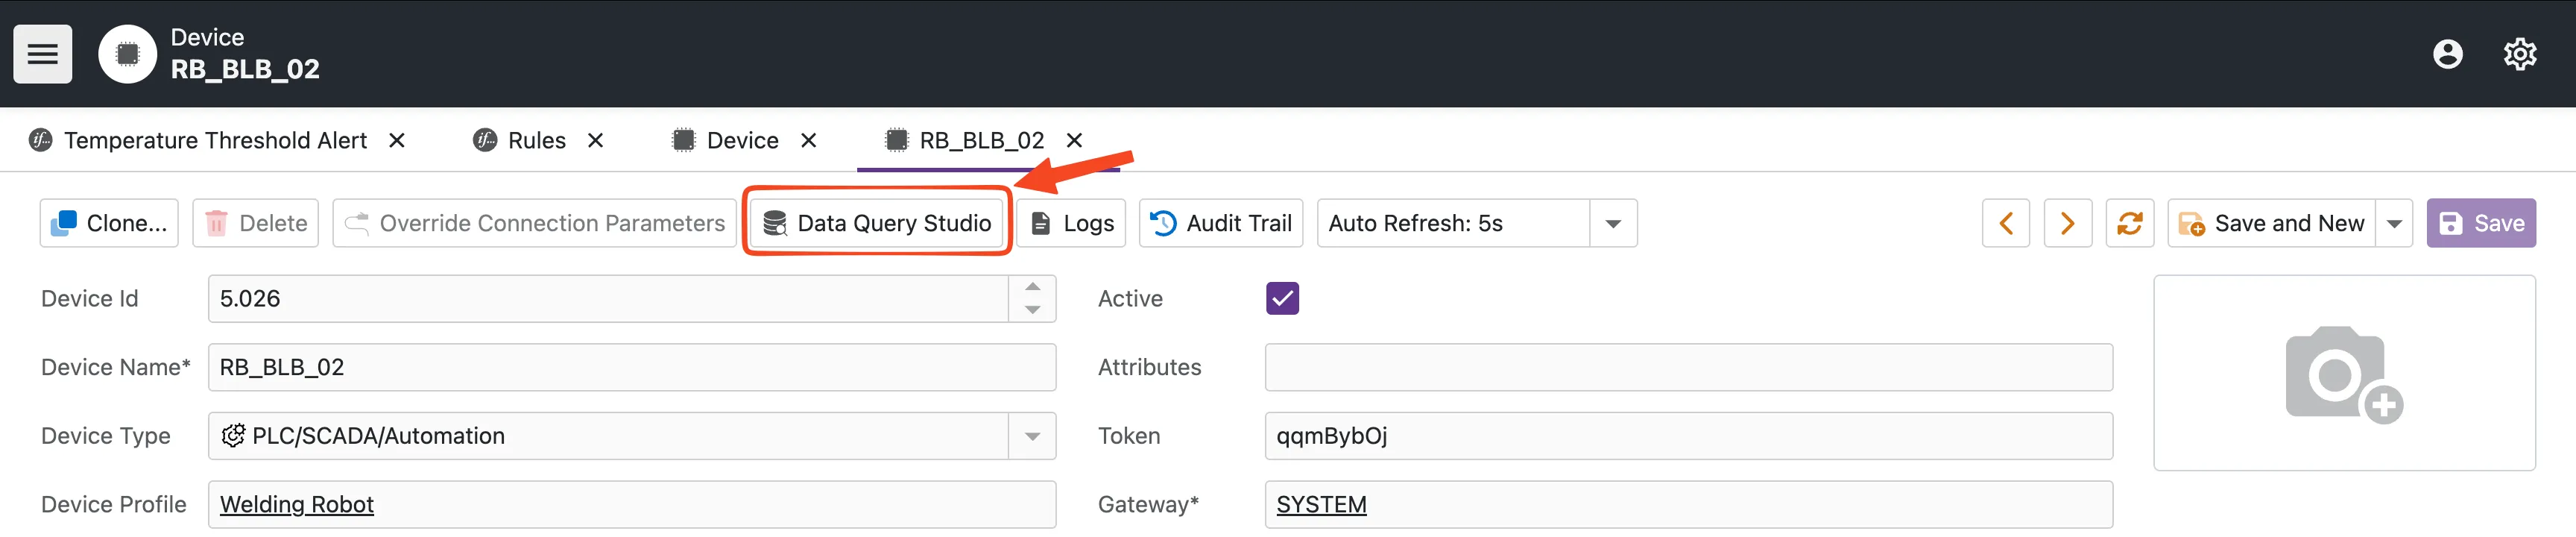
You can access the Data Query Studio directly from any device detail page.
- Navigate to Devices in the main menu.
- Select the device you want to inspect.
- Click the Data Query Studio action (database icon) in the toolbar.
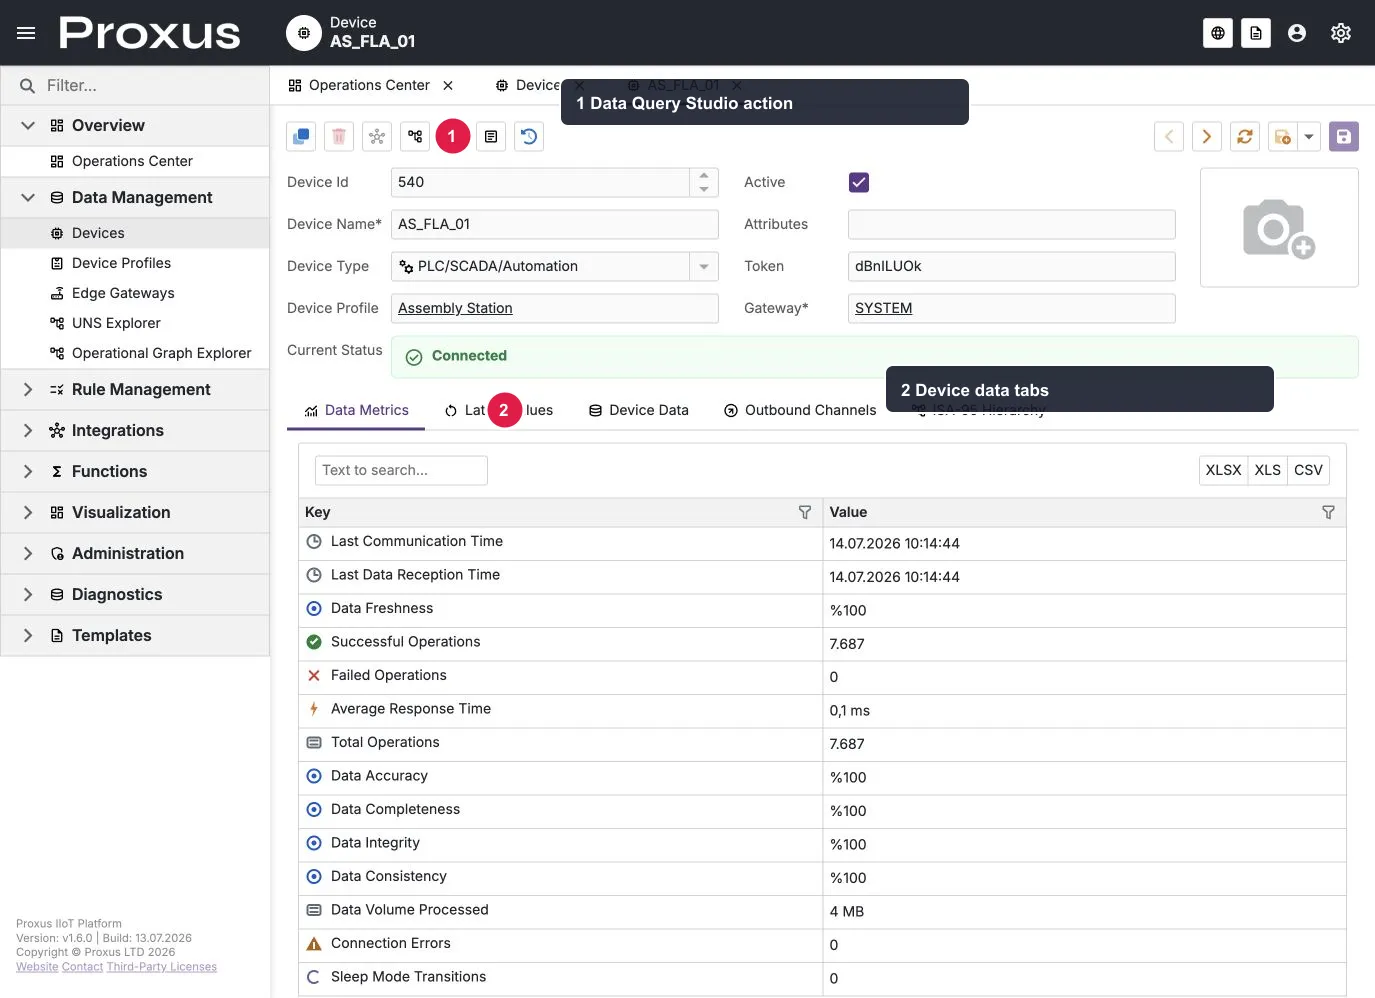
The local English demo was verified: open a device detail and use the Data Query Studio toolbar action (1). The device detail also exposes the Data Metrics, Latest Values, and Device Data tabs (2), which are separate from the query workspace.
Building Your Query
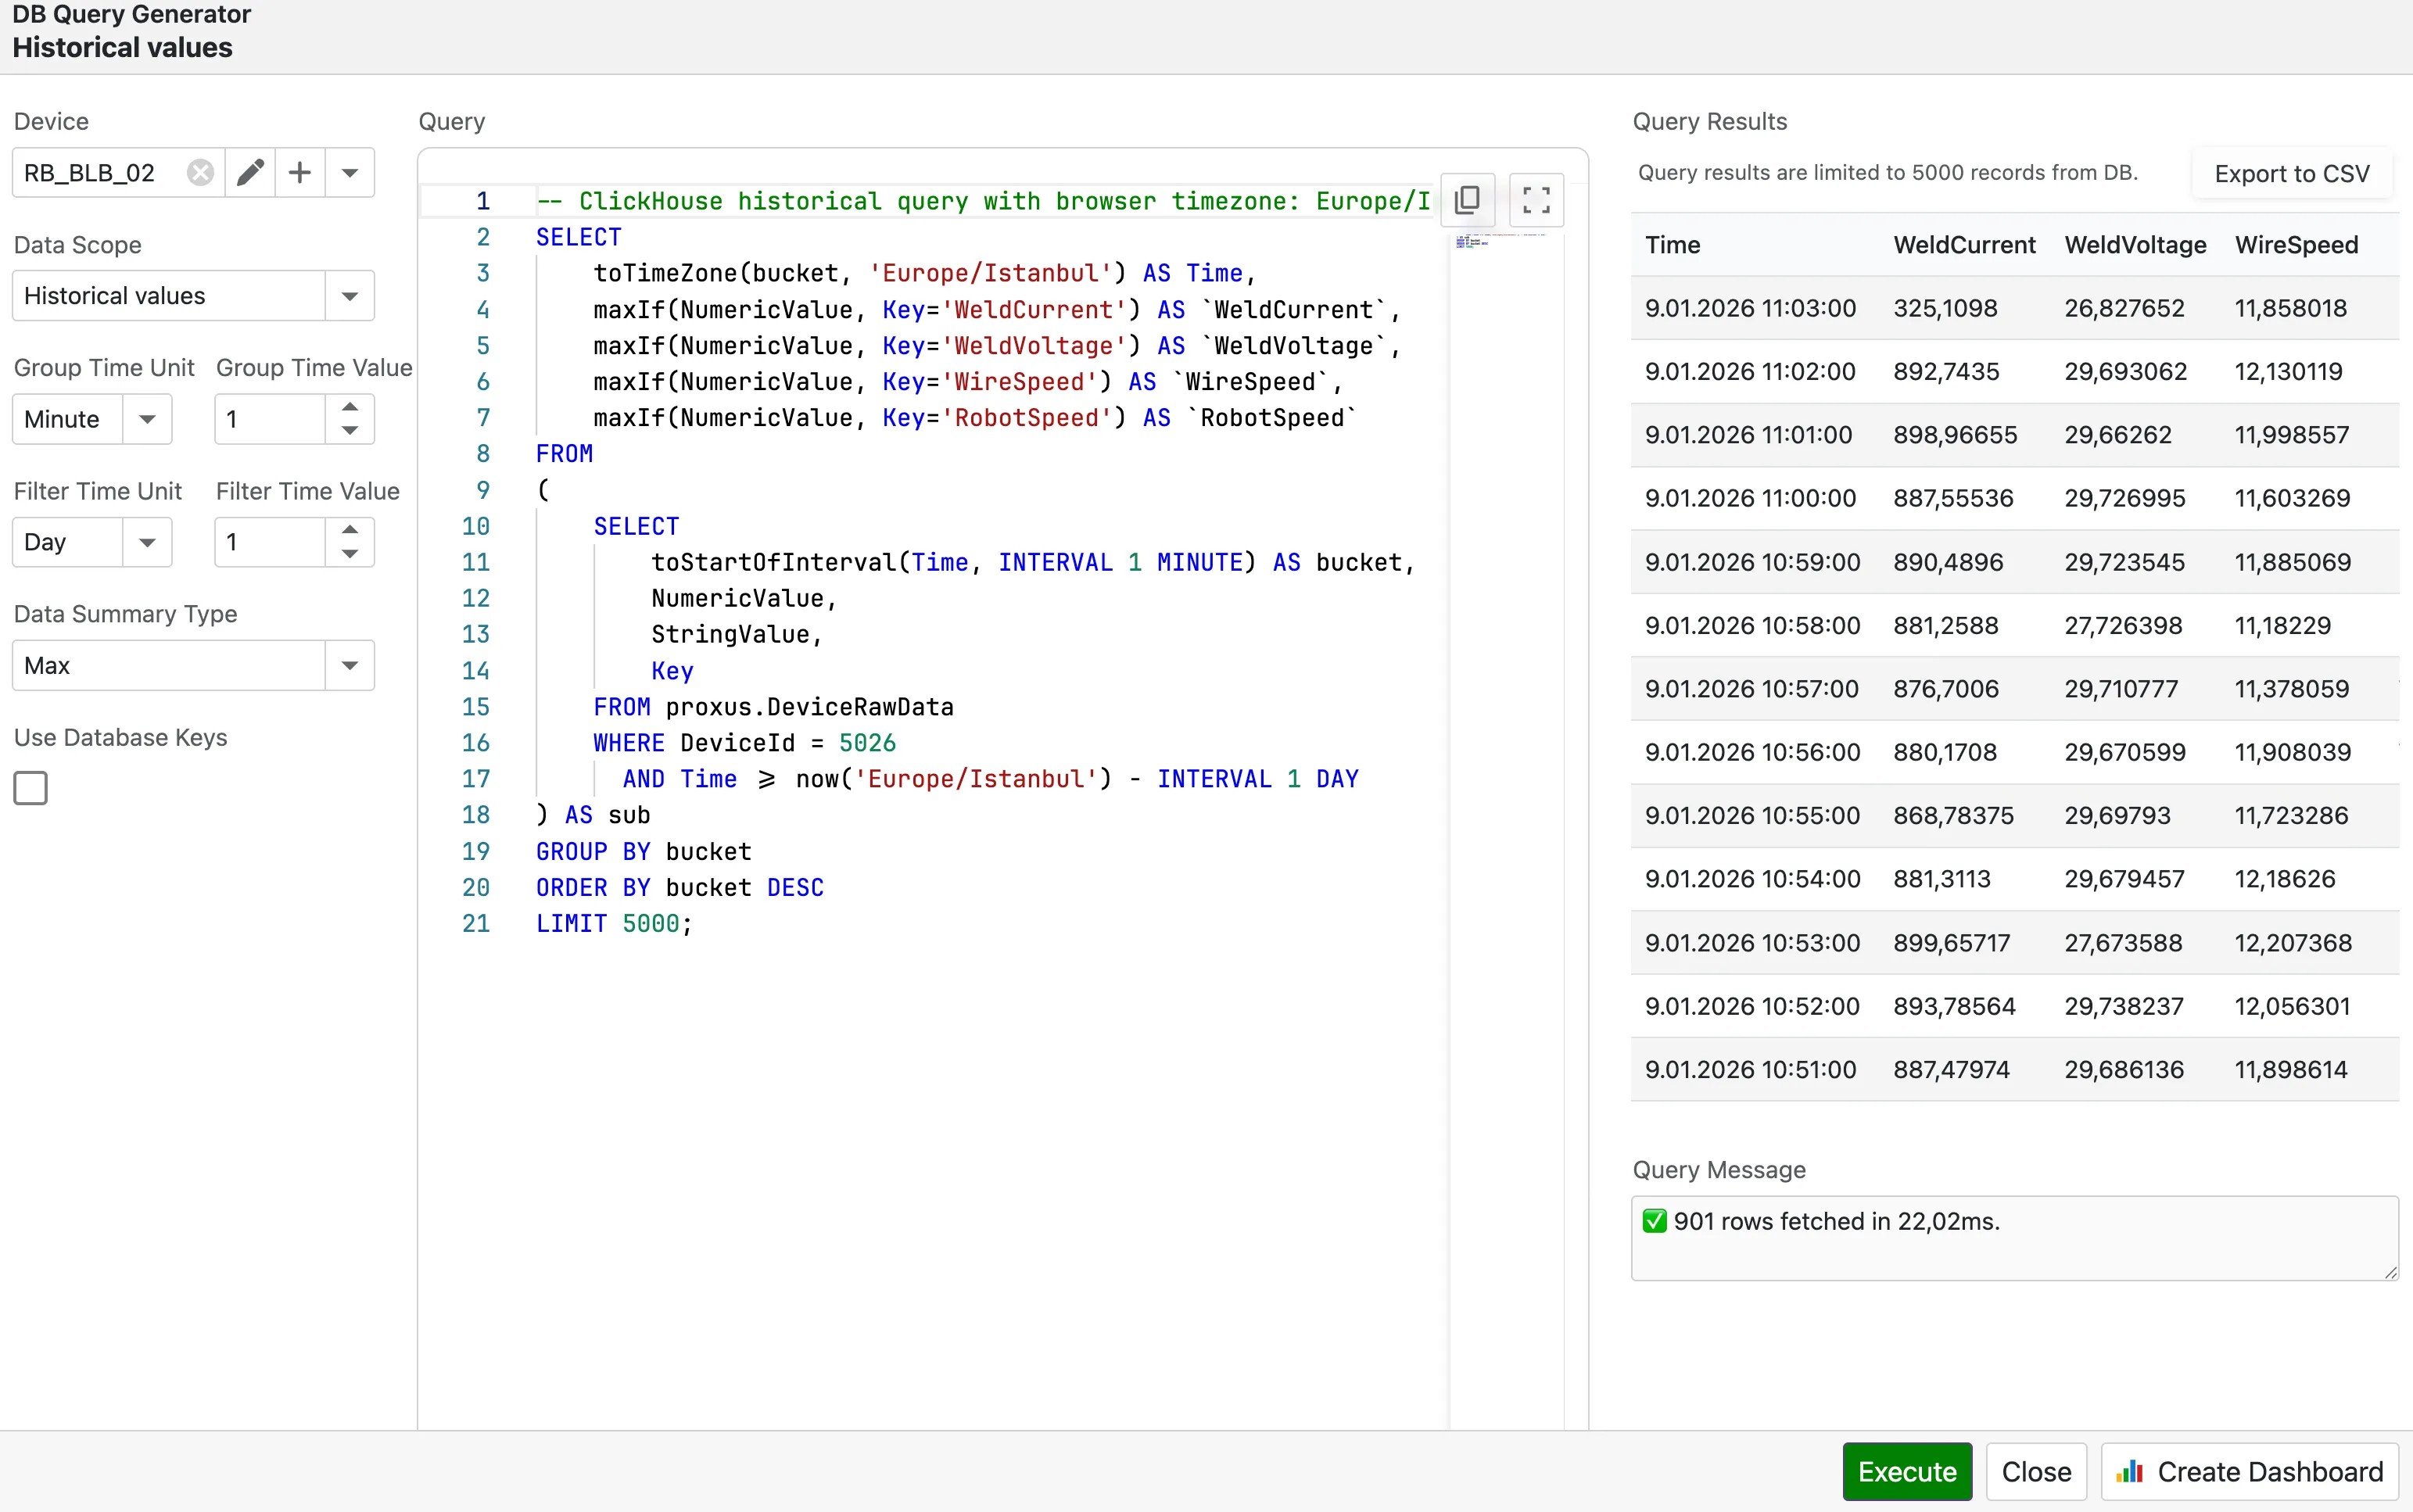
You do not need to be a database expert. The studio uses a simple parameter-based builder:
- Define Scope: Choose the Time Unit and Time Value (e.g., "Last 2 Days").
- Optimize Granularity: Select a Group Unit (e.g., "10 Minutes") if you want to see trends without downloading millions of data points.
- Generate: Click Generate Query to let the system build the optimal SQL for you.
Tip: Grouping (downsampling) makes long ranges much faster. For example, "Last Month" grouped by "1 Hour" is much faster than viewing raw data.
Analyzing & Exporting Results
Once you run a query, your data appears in a flexible grid view:
- Filter & Sort: Click headers to sort or use the filter row to narrow down results (e.g., find all values > 100).
- Export: Use the export menu to download your findings as CSV or Excel files to share with your team.
Turning Insights into Dashboards
The main value of Query Studio is that a useful analysis can become a dashboard later. If you create a query like "Daily Average OEE for Line 1", you do not need to rebuild it next time.
- Execute your query and verify the results.
- Click Create Dashboard.
- Proxus automatically creates a new Dashboard with your data pre-loaded.
- Drag-and-drop charts, gauges, and grids to visualize it.
For the full workflow (layouts, widgets, and ClickHouse SQL bindings), see Creating Dashboards.
System Protection (Smart Guard)
Proxus is designed for mission-critical operations. To keep large queries from slowing down the factory network or crashing your browser, the Smart SQL Guard is always active.
- Safe Limits: Queries are limited to 50,000 rows. If you need more data, try increasing the grouping interval.
- Read-Only: The system blocks commands that could modify or delete data.
Ready to explore? Open any device page and launch Data Query Studio when you need to investigate or export data.
Adjust default time ranges and max data loads for charts via the Data Settings section in Proxus-config.toml.