This guide will walk you through deploying the Proxus stack locally and connecting a simulated device to witness real-time data flow.
Prerequisites
Docker Engine 4GB+ RAM
Ensure you have Docker and Docker Compose installed on your machine.
Deployment
The fastest way to get Proxus running is using the automated installer for your operating system:
curl -fsSL https://proxus.io/install.sh | bashirm https://proxus.io/install.ps1 | iexThe installer creates the proxus-platform directory, asks for culture and timezone, and can start the stack for you. If you choose not to start it during installation, run:
cd proxus-platform
docker compose up -d
Wait about 30-60 seconds for the containers to initialize. Then open the Management Console at http://localhost:8080.
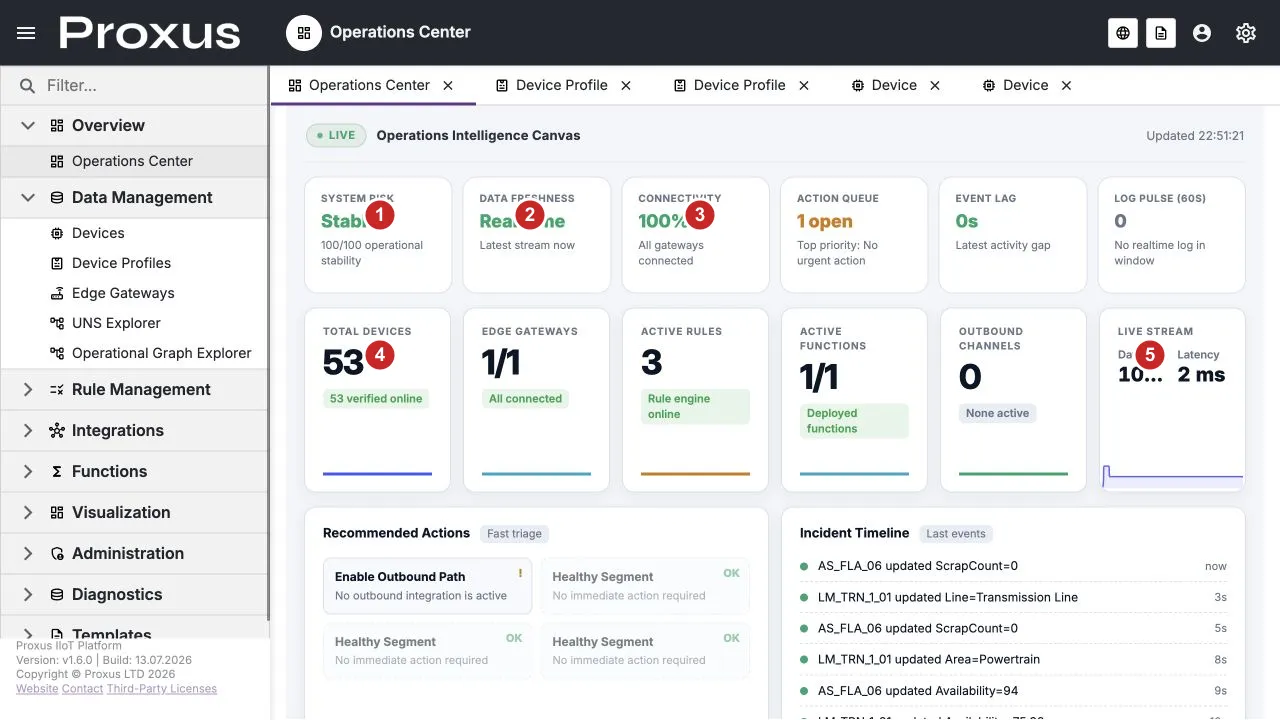
The runtime-verified overview highlights system risk (1), data freshness (2), connectivity (3), total devices (4), and live stream health (5). This capture was verified against the English demo UI on 13 July 2026.
- Username:
Admin - Password: (Leave blank)
Proxus requires a license to activate gateways. You can request a free demo license at proxus.io/contact.
Connecting a Simulator
Since you likely do not have a physical PLC connected to your development machine, we will use the built-in Simulator protocol to generate data.
Create a Device Profile
- Navigate to Data Management > Device Profiles in the sidebar.
- Click New.
- Name it
Simulated Generator. - Select Protocol:
SIMULATOR. - Add the following Tags (the Address field defines the
[min,max]range):- Name:
Temperature, Address:[20,80], Type:Double - Name:
Vibration, Address:[0,5], Type:Double - Name:
Status, Address:[0,1], Type:Bool
- Name:
- Click Save.
Add the Device
- Navigate to Data Management > Devices.
- Click New.
- Name:
Gen_01. - Profile: Select
Simulated Generator. - Gateway: Select the default
SYSTEMgateway (this is the local gateway installed with your server). - Click Save.
Activate
In the devices list, find Gen_01. You will notice it is Passive by default. Check the Active box. The system will deploy the configuration to the Gateway immediately.
Verify Data Flow
To confirm that data is flowing into the platform:
- Click on the
Gen_01device name to open the details view. - Switch to the Latest Values tab.
- You should see
TemperatureandVibrationvalues updating live without refreshing the page. - Click a trend cell to open the fullscreen signal view if you want to inspect recent history or switch to Raw mode.
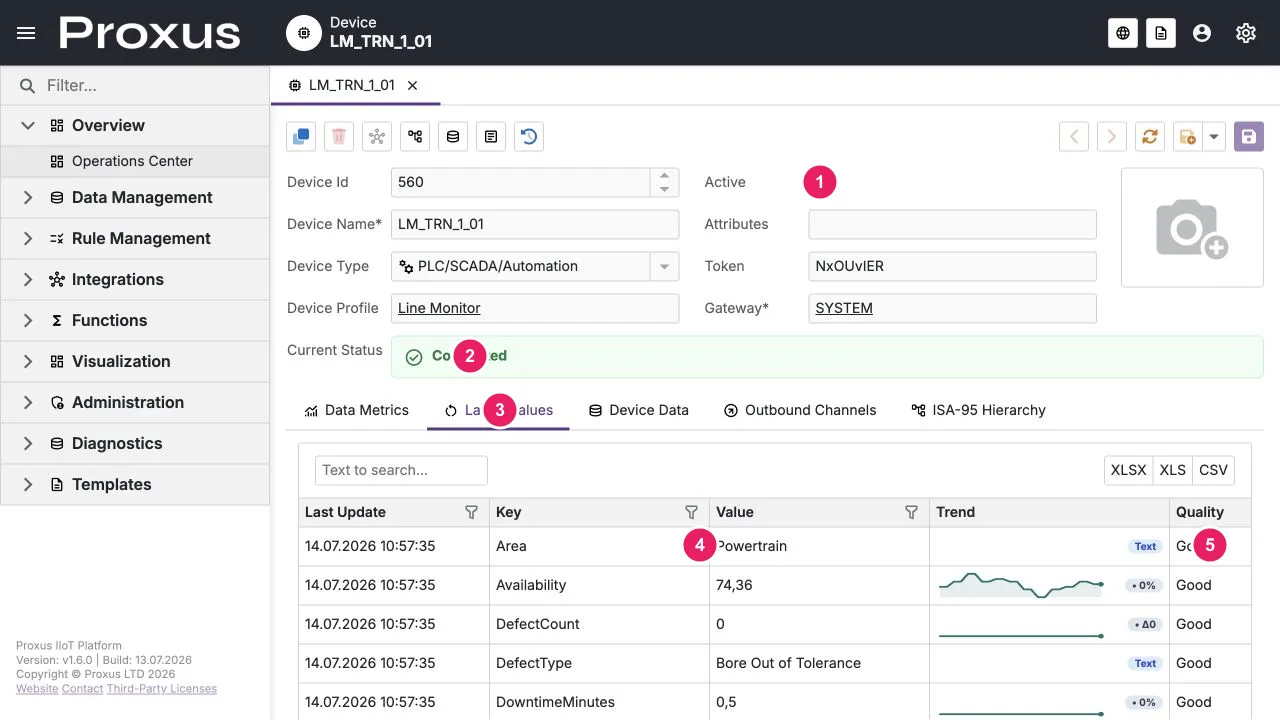
Use the annotated view to confirm the active state (1), connected status (2), selected Latest Values tab (3), live values (4), and quality column (5).
Congratulations! You have successfully deployed Proxus and ingested your first data stream.
Build Your First Dashboard
Now that data is flowing, let's visualize it with a simple dashboard.
Create a Dashboard
Navigate to Visualization > Dashboards and click New Dashboard. Name it Quick Start Monitor.
Add a Gauge
Drag a Gauge widget from the toolbox onto the canvas.
Bind Data
Click the Gauge, open the Data Source panel, select New SQL Query, and enter:
SELECT avg(Value) as Temperature
FROM DeviceRawData
WHERE TagName = 'Temperature'
  AND DeviceName = 'Gen_01'
  AND Time > now() - INTERVAL 5 MINUTE
Configure Appearance
Set Min to 20, Max to 80. Add color ranges: Green (20–50), Yellow (50–65), Red (65–80).
Enable Auto-Refresh
Set Auto-Refresh to 10 seconds in the toolbar. Your gauge should now show a live temperature reading.
You now have a complete pipeline: device → data collection → visualization.
Next Steps
Now that you have live data and a dashboard, explore the platform architecture or start building automation rules.