The UNS Explorer is the primary interface for visualizing the real-time state of your industrial operation based on the Unified Namespace (ISA-95) architecture.
Unlike the "Devices" list which organizes data by hardware connection, the UNS Explorer organizes data by Business Context.
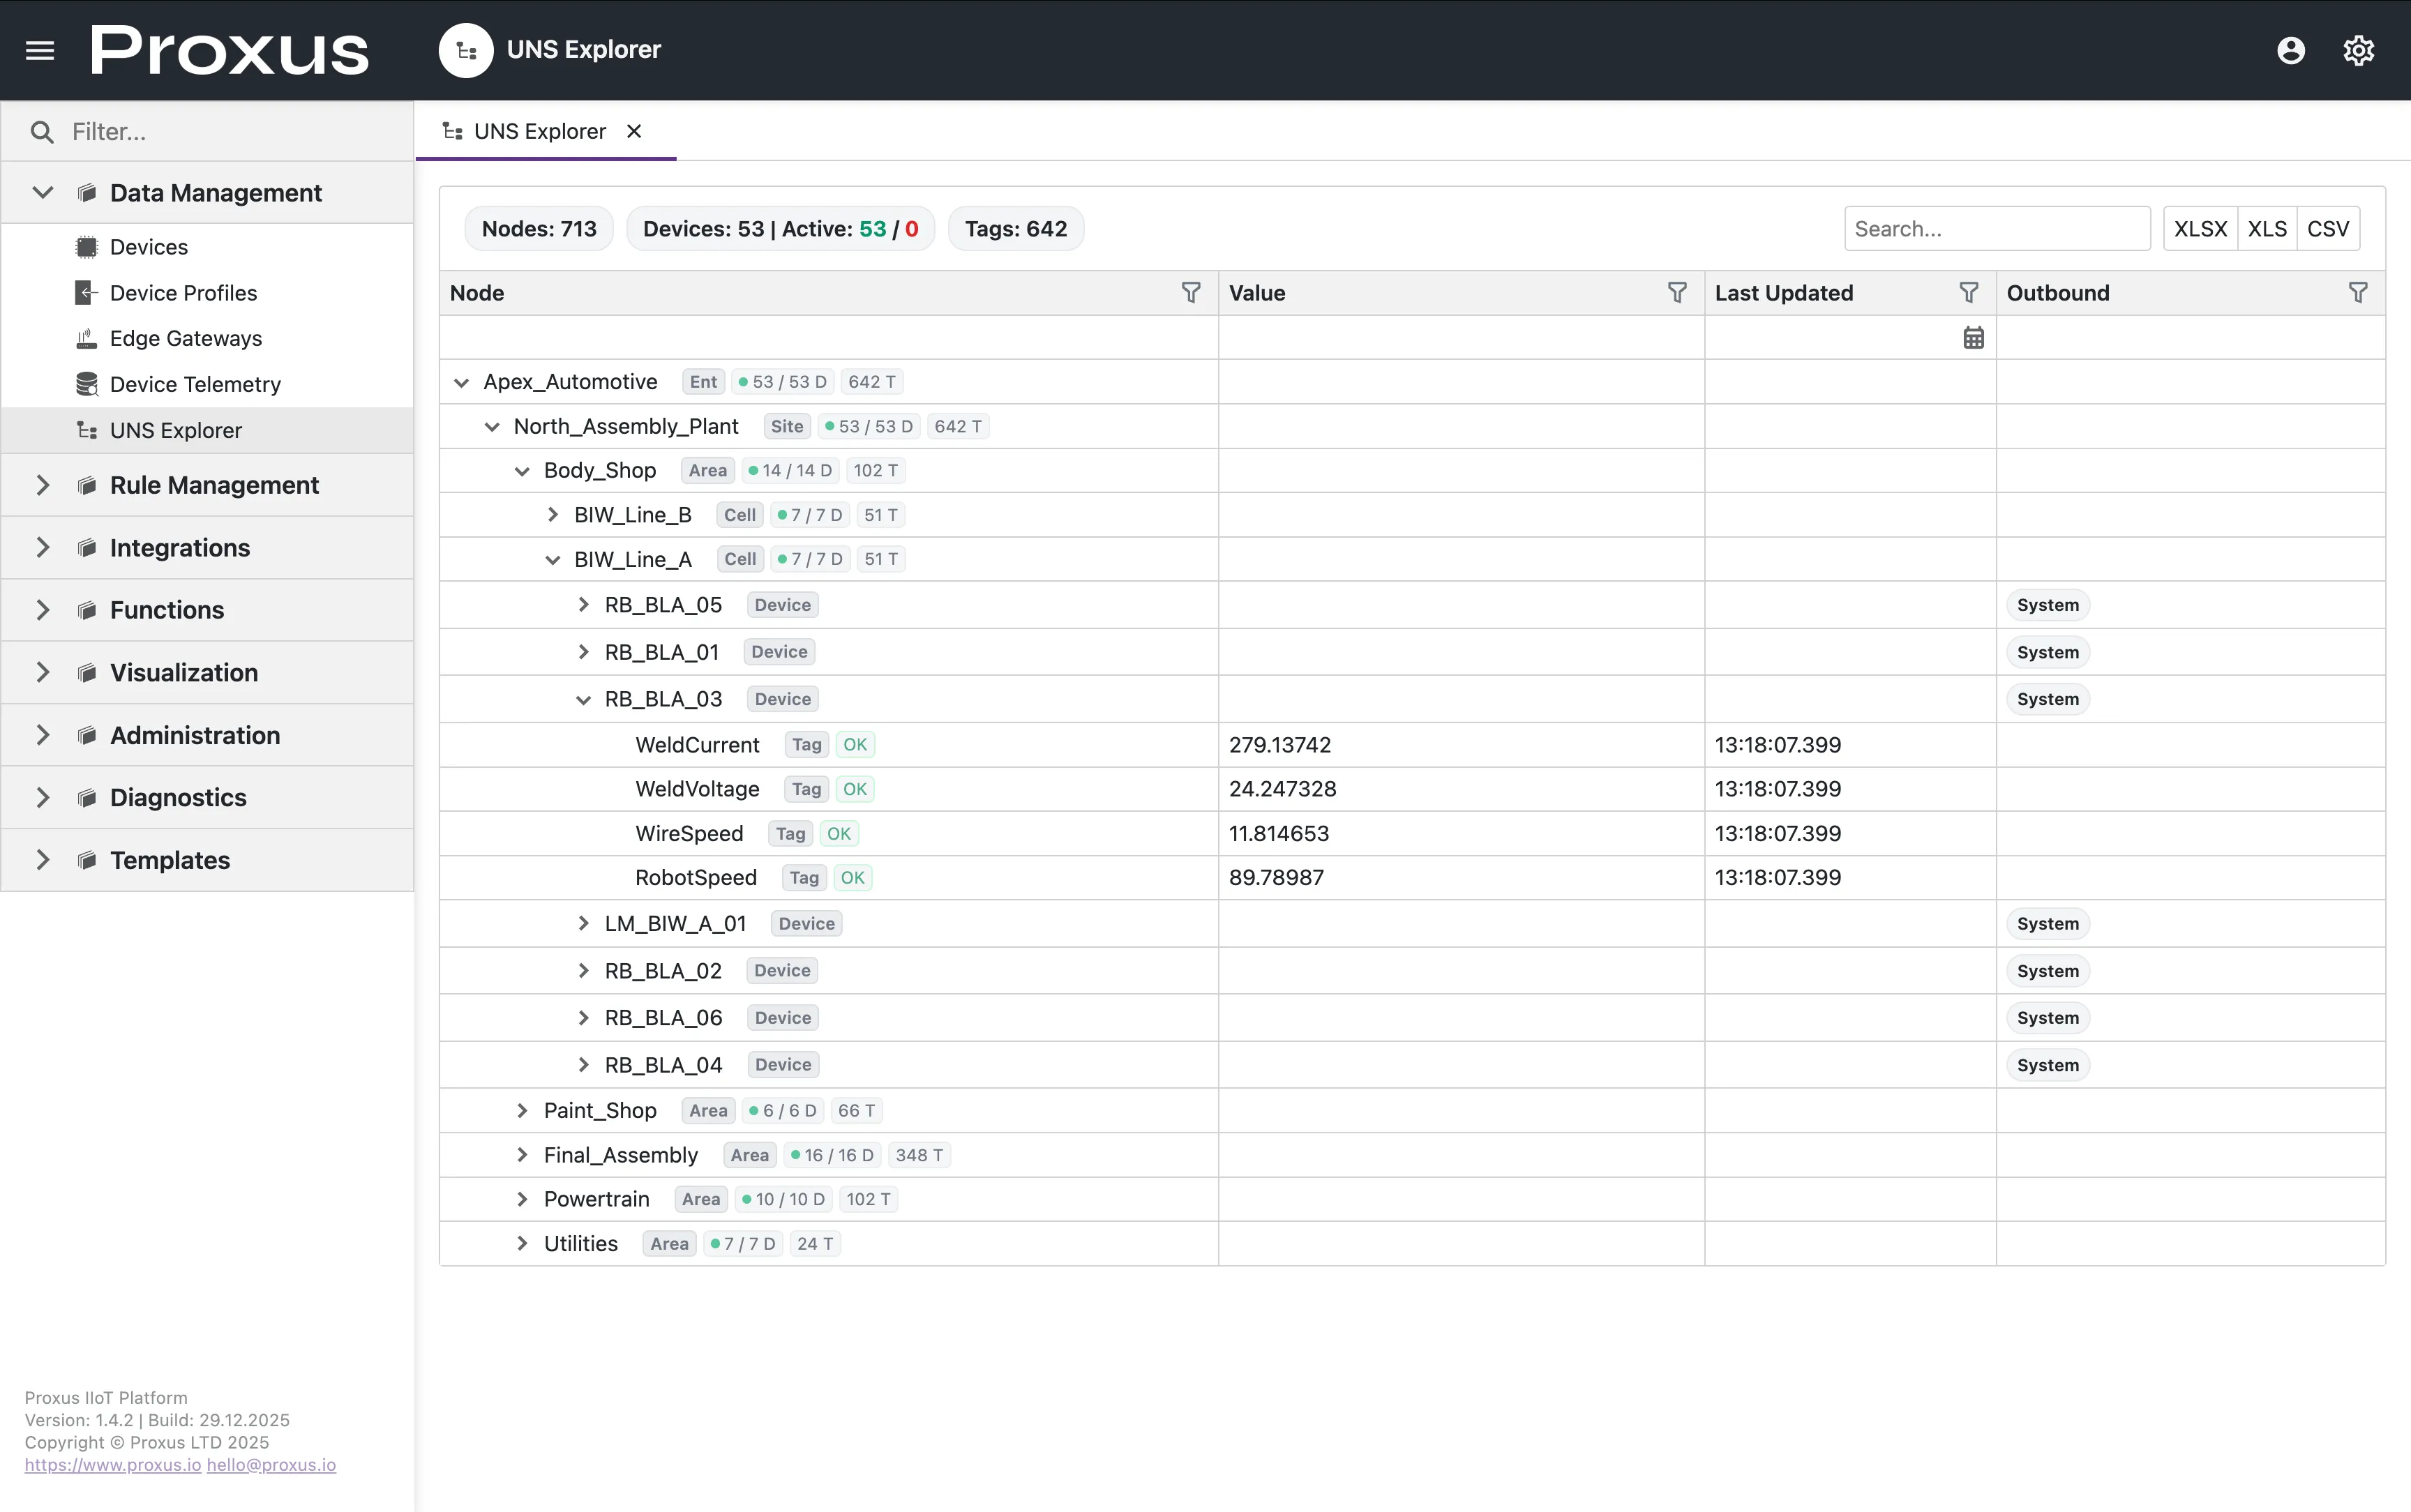
Interface Overview
Navigate to Data Management > UNS Explorer in the sidebar.
The Hierarchy Tree
The left panel displays the semantic tree structure: Enterprise > Site > Area > Process Cell > Equipment > Metric
- Nodes: Represent logical groupings (Site, Area, Line).
- Leaves: Represent actual data points (Tags).
Nodes visible in this tree are filtered based on your user role. Administrators can control this visibility via UNS Topic Permissions.
Real-Time Grid
When you select a folder (e.g., BIW_Line_A), the main grid displays all tags within that context.
- Value: The current live value shown with its unit when available (e.g.,
12.5 bar). Updates flash briefly when changed. - Trend: Tag rows include a compact live trend preview so operators can spot recent movement immediately. Clicking the preview opens the fullscreen historical trend view.
- Timestamp: Time of the last update.
The UNS Explorer search also matches unit text. For example, searching bar lists metrics carrying that unit.
Real-Time Visualization
The interface updates automatically as new data arrives from the Edge Gateways.
- Live Values: Metrics like Temperature, Speed, and Status update in real-time.
- Status Indicators: Devices show Active/Inactive states (e.g.,
53 / 53 Dactive devices). - Outbound Status: Shows where the data is being routed (e.g.,
System).
To ensure platform stability and browser performance, internal UNS updates in the UI are throttled at 500ms per metric. This prevents UI lockups during massive high-frequency data bursts while maintaining a responsive user experience.
The inline trend preview uses this same throttled live stream, which keeps the UNS grid responsive even when the namespace contains many active tags.
Node Metadata
Clicking on any node reveals its System Properties:
- Topic Path: The full MQTT topic (e.g.,
Apex_Automotive/North_Plant/Body_Shop/BIW_Line_A/WeldCurrent). - Source Device: Which physical device is feeding this node.
- Update Rate: The effective frequency of data changes.
The UNS Explorer is currently a read-only interface for monitoring. To change data values (write-backs), you must use the Device Control functions or User Scripts.