The Data Query Studio is your primary tool for ad-hoc data analysis. Whether you need to investigate a production anomaly, export a specific dataset for a report, or troubleshoot a device connectivity issue, Query Studio gives you direct, safe access to your historical data.
It bridges the gap between raw database access and visual dashboards, allowing you to ask questions of your data without writing complex code.
Why Use Data Query Studio?
- Troubleshooting: Quickly pull up the last hour of temperature data for a specific machine to see what happened before a failure.
- Ad-Hoc Reporting: Generate a dataset for a specific time range and export it to Excel for offline analysis.
- Dashboard Prototyping: Experiment with different data views and, when you find a useful one, turn it into a permanent dashboard with a single click.
Getting Started
Accessing the Studio
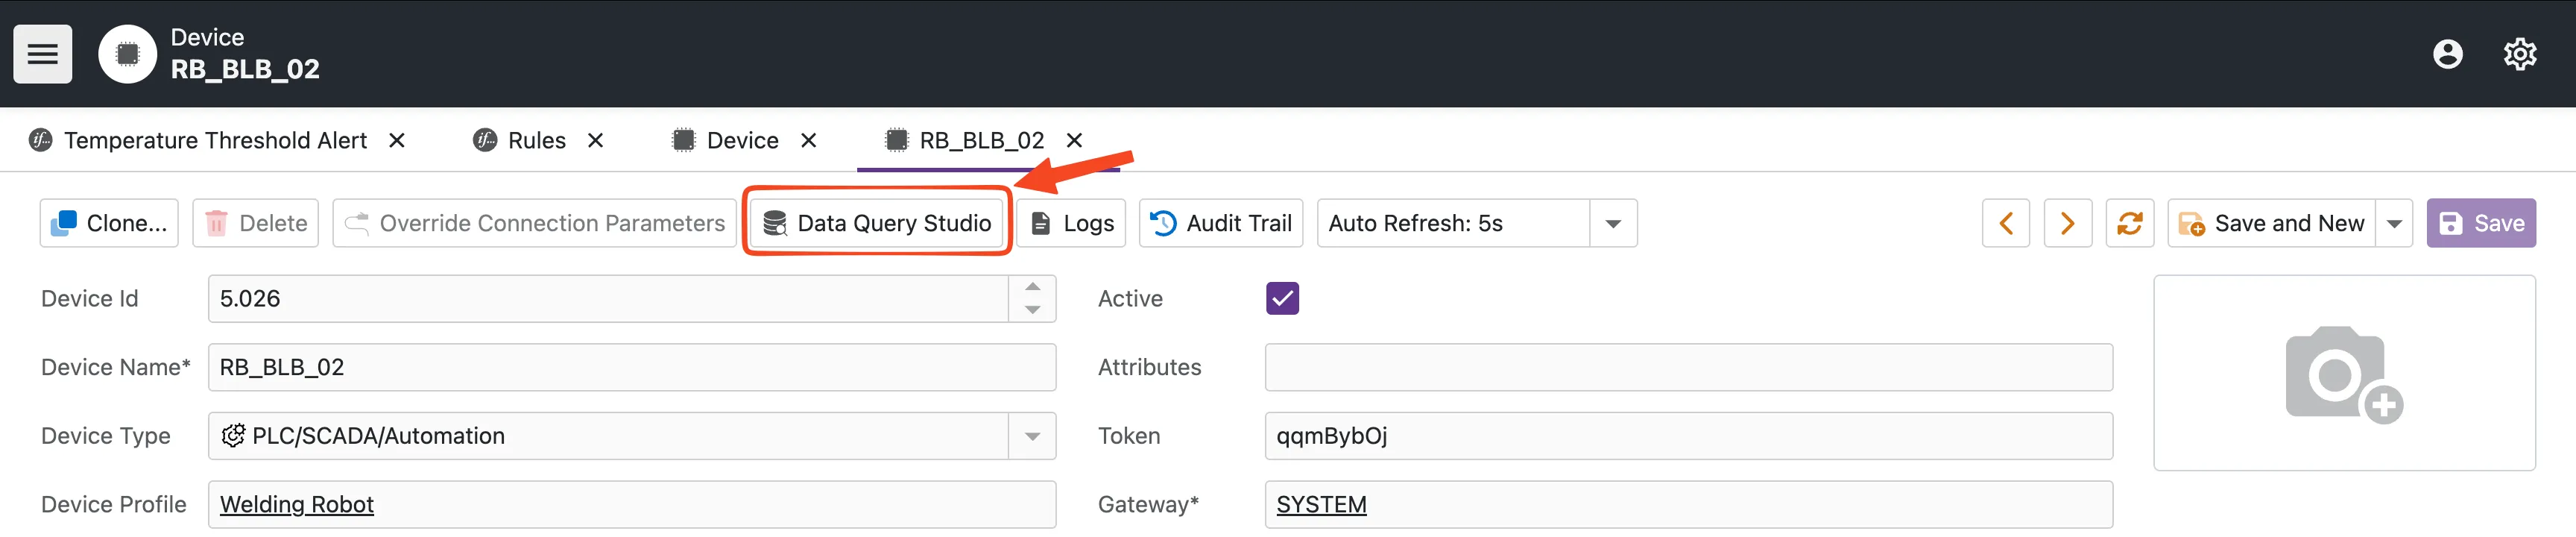
You can access the Data Query Studio directly from any Device's detail page.
- Navigate to Devices in the main menu.
- Select the device you want to analyze.
- Click the Data Query Studio action (database icon) in the toolbar.
Building Your Query
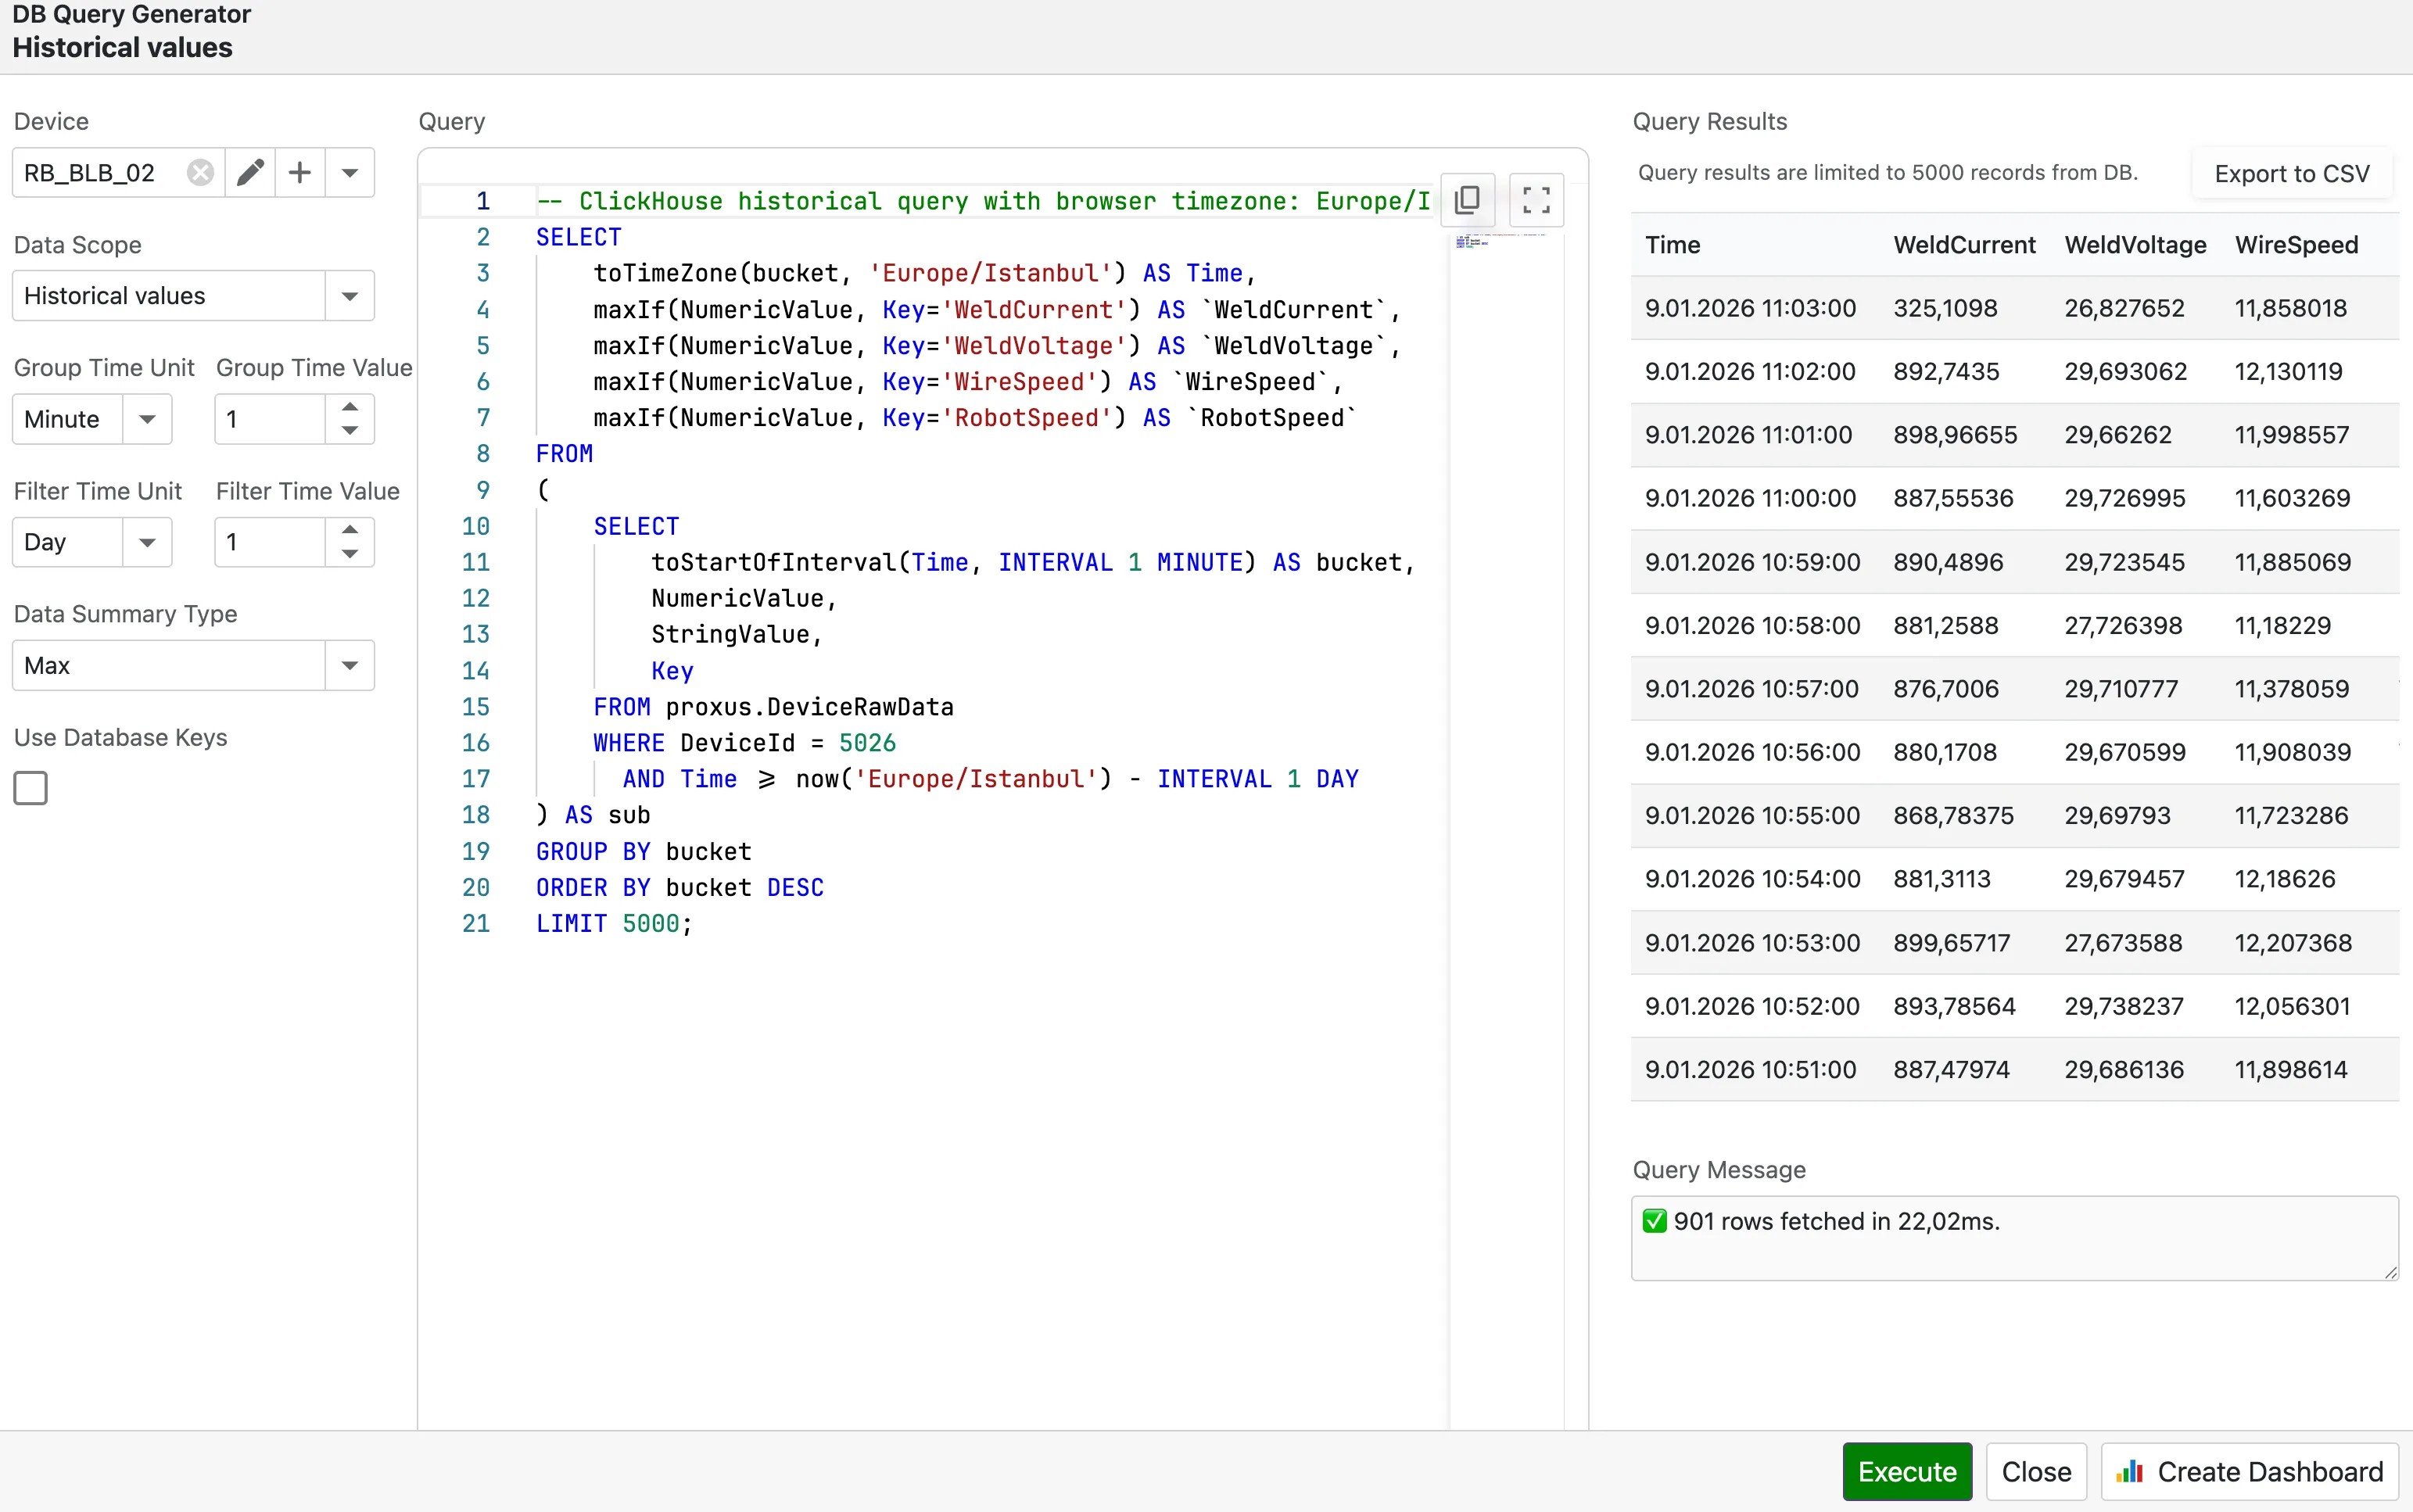
You don't need to be a database expert to get answers. The studio uses a simple parameter-based builder:
- Define Scope: Choose the Time Unit and Time Value (e.g., "Last 2 Days").
- Optimize Granularity: Select a Group Unit (e.g., "10 Minutes") if you want to see trends without downloading millions of data points.
- Generate: Click Generate Query to let the system build the optimal SQL for you.
Pro Tip: Using grouping (downsampling) significantly speeds up reports over long time ranges. For example, viewing "Last Month" grouped by "1 Hour" is much faster than viewing raw data.
Analyzing & Exporting Results
Once you execute a query, your data appears in a flexible grid view:
- Filter & Sort: Click headers to sort or use the filter row to narrow down results (e.g., find all values > 100).
- Export: Use the export menu to download your findings as CSV or Excel files to share with your team.
Turning Insights into Dashboards
The most powerful feature of Query Studio is the ability to make your analysis permanent. If you create a useful query (e.g., "Daily Average OEE for Line 1"), you don't have to rebuild it next time.
- Execute your query and verify the results.
- Click Create Dashboard.
- Proxus automatically creates a new Dashboard with your data pre-loaded.
- Drag-and-drop charts, gauges, and grids to visualize it.
For the full workflow (layouts, widgets, and ClickHouse SQL bindings), see Creating Dashboards.
System Protection (Smart Guard)
Proxus is designed for mission-critical operations. To prevent a massive query from slowing down the factory network or crashing your browser, the Smart SQL Guard is always active.
- Safe Limits: Queries are automatically limited to 50,000 rows. If you need more data, try increasing the grouping interval.
- Read-Only: The system strictly prevents any commands that could modify or delete data, ensuring total data integrity.
Ready to explore? Go to any Device page and launch the Data Query Studio to start uncovering insights in your data.
Adjust default time ranges and max data loads for charts via the Data Settings section in Proxus-config.toml.