While Audit Logs track user actions, System Logs capture the technical heartbeat of the Proxus platform. This stream aggregates logs from the backend API, edge gateways, actors, and integration points.
Accessing Logs
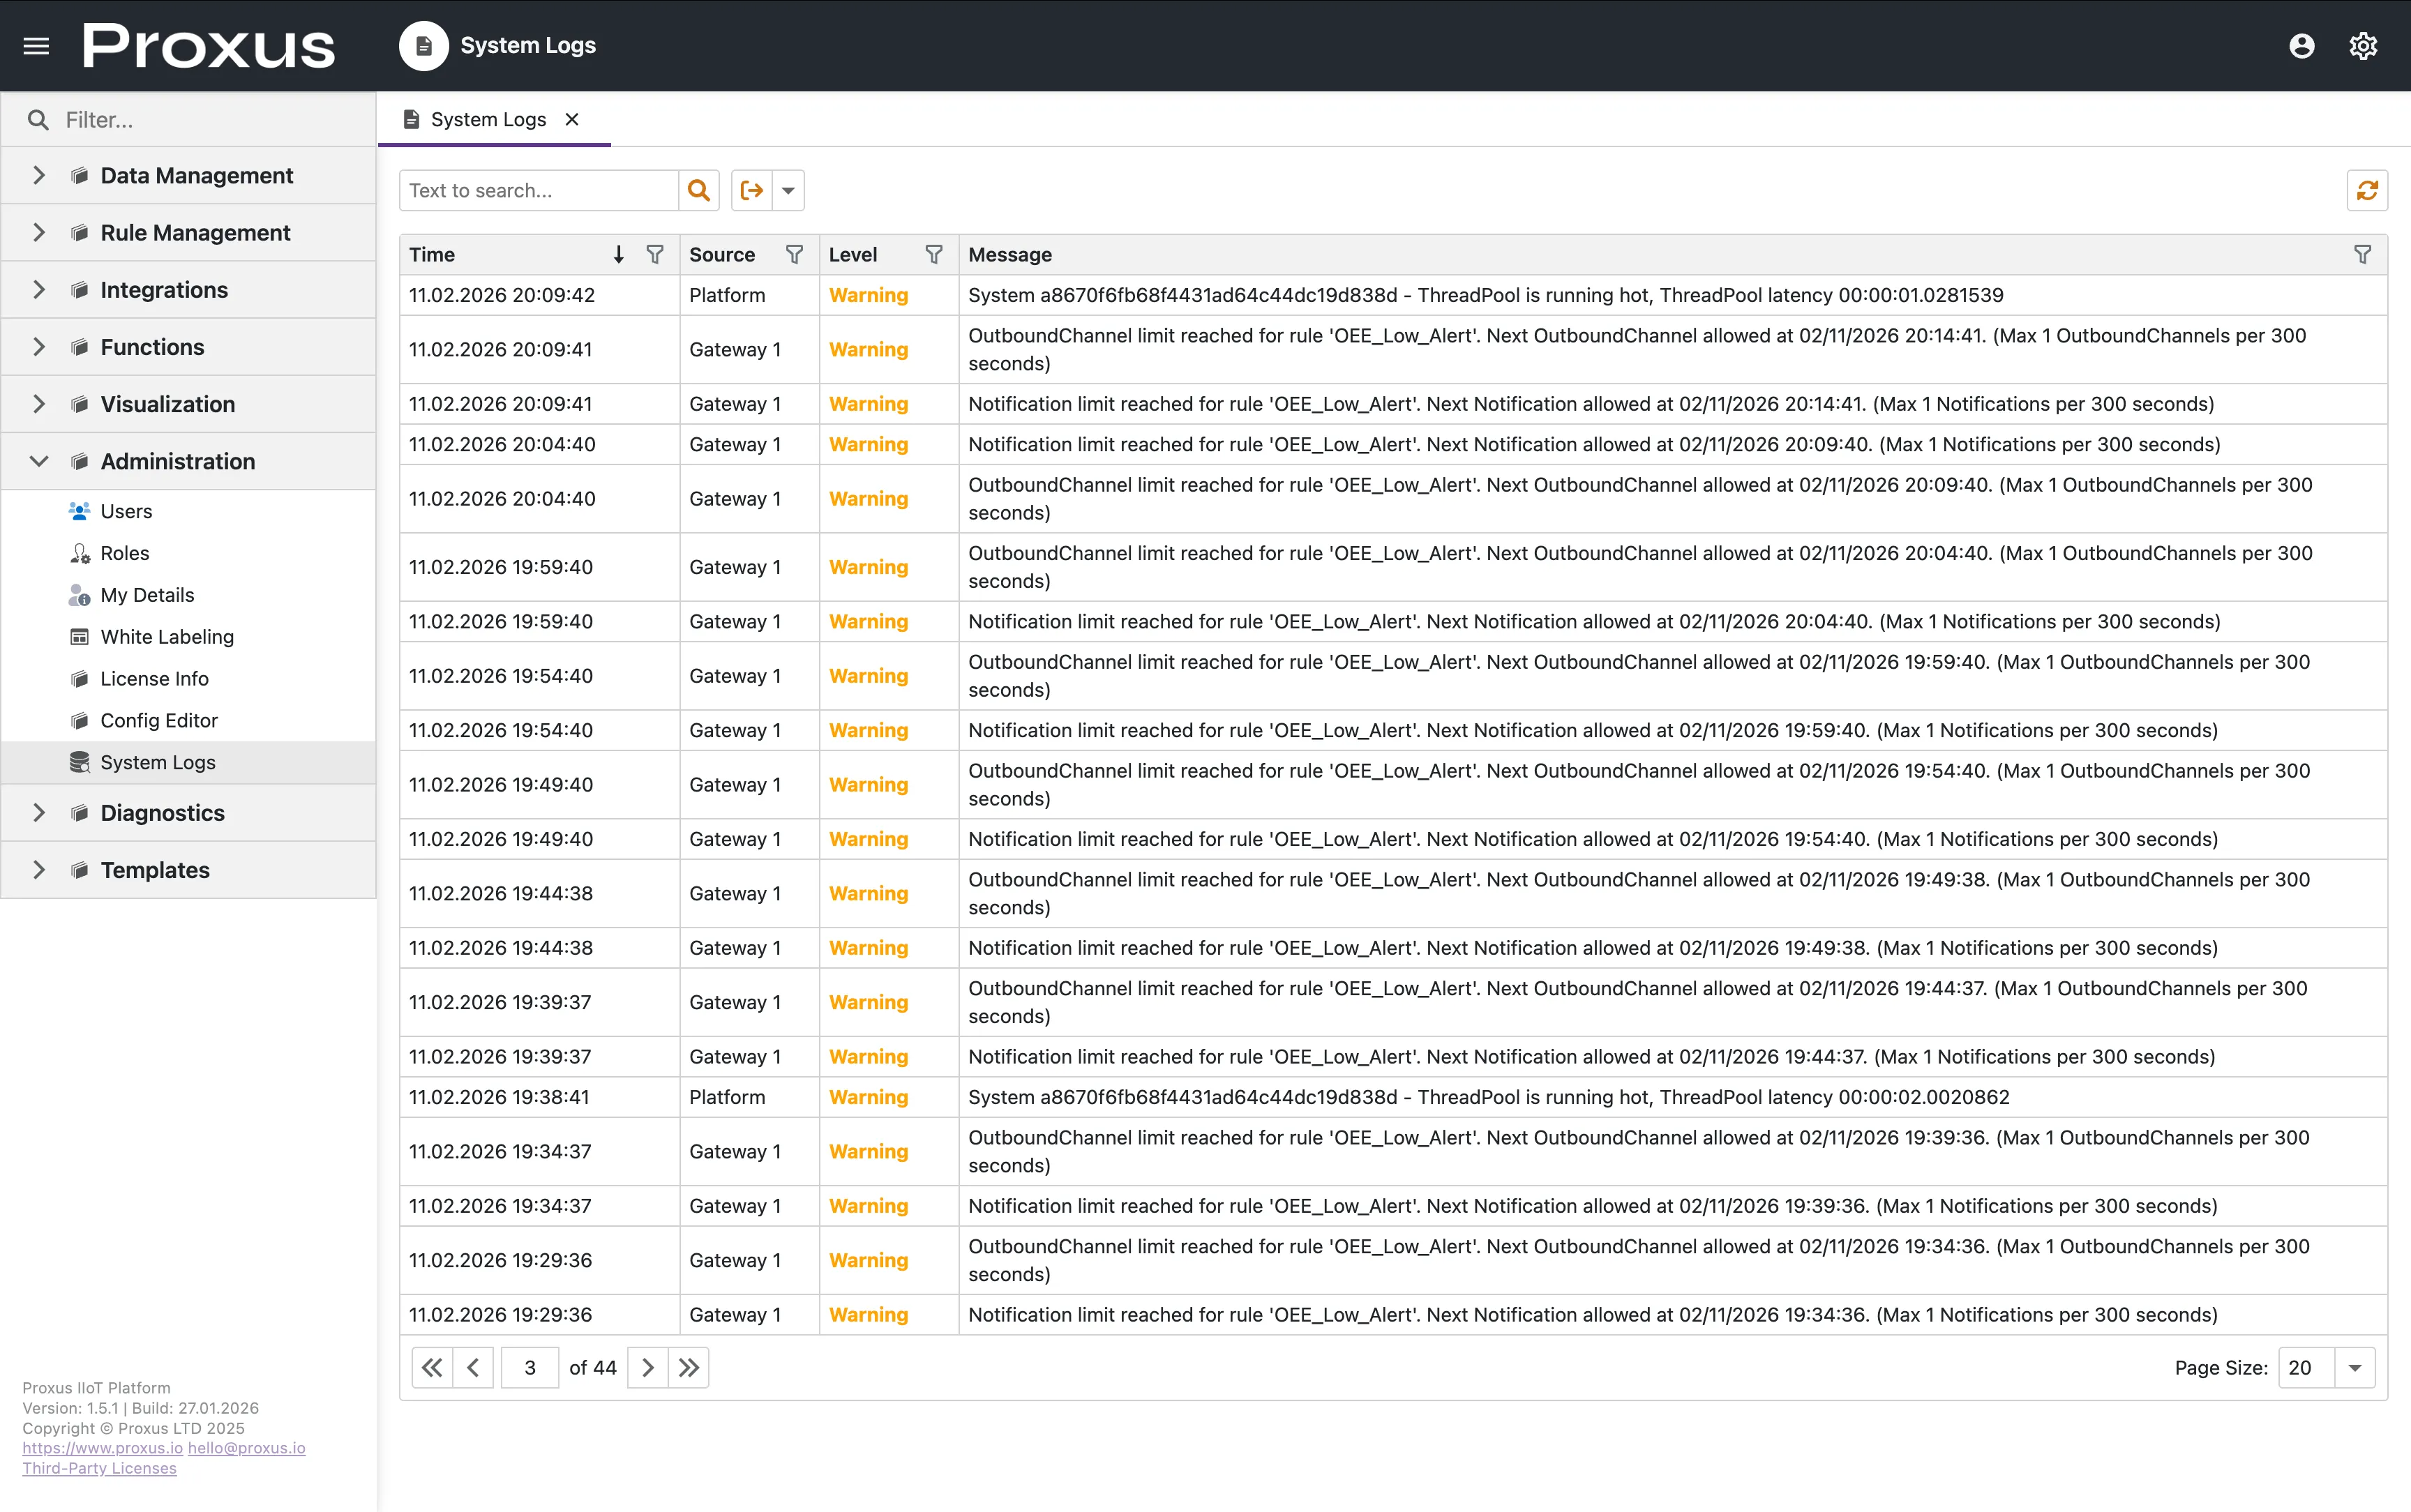
Navigate to Administration > System Logs.
Log Structure
The log viewer provides a real-time, filterable grid with the following columns:
- Time: Precise UTC timestamp of the event.
- Source: The origin subsystem (e.g.,
Platform,DeviceActor,MQTTBroker). - Level: Severity of the log entry.
- Message: The detailed log content, including stack traces for errors.
Log Levels
Proxus uses standard logging levels to categorize events:
| Level | Description |
|---|---|
| Critical | Fatal errors causing system shutdown or major failure. |
| Error | Runtime errors that need attention but don't stop the system. |
| Warning | Potential issues or unexpected behavior. |
| Information | Normal system events (startup, connection status). |
| Debug | Detailed diagnostic information (enabled via config). |
| Trace | Extremely detailed low-level logs (development only). |
Configuration
System logging behavior is controlled via the central Proxus-config.toml file. See the Configuration File Reference for full details. In Docker deployments, the default log level is set to Warning (Loglevel=3) to minimize noise.
[Logging]
# 0:Trace, 1:Debug, 2:Information, 3:Warning, 4:Error, 5:Critical
Loglevel = 3

# Days to keep logs in the database before auto-purging
LogRetentionTime = 14

# Enable logging to local files in /config directory
LogToFile = true
Enhanced Monitoring Areas
To assist with troubleshooting, Proxus automatically captures detailed diagnostic data (Debug level) for specific critical subsystems, even when the global log level is set to Warning. This ensures you have deep visibility where it matters most:
| Functional Area | What is Logged |
|---|---|
| AI Agents (MCP) | Detailed interactions between the AI assistant and the platform, useful for debugging context and command execution. |
| External Integrations | Comprehensive tracking of outbound data flow to MQTT brokers, HTTP endpoints, and third-party APIs. |
| Data Storage | Granular monitoring of database persistence tasks to verify data integrity and write performance. |
| Database Queries | Execution details of complex queries for performance analysis. |
| Custom Scripting (SDK) | All debug output from user-defined scripts and logic, ensuring developers can troubleshoot their code effectively. |
Proxus utilizes ZLogger with NATS JetStream for zero-allocation logging. This ensures that even high-volume debug logging has minimal impact on platform performance.