The Device Detail View is the place to check one device from end to end. It connects directly to the Edge Gateway so you can see live telemetry, health metrics, history, and routing in one view. For configuration history, you can also check the Audit Logs.
Header Controls
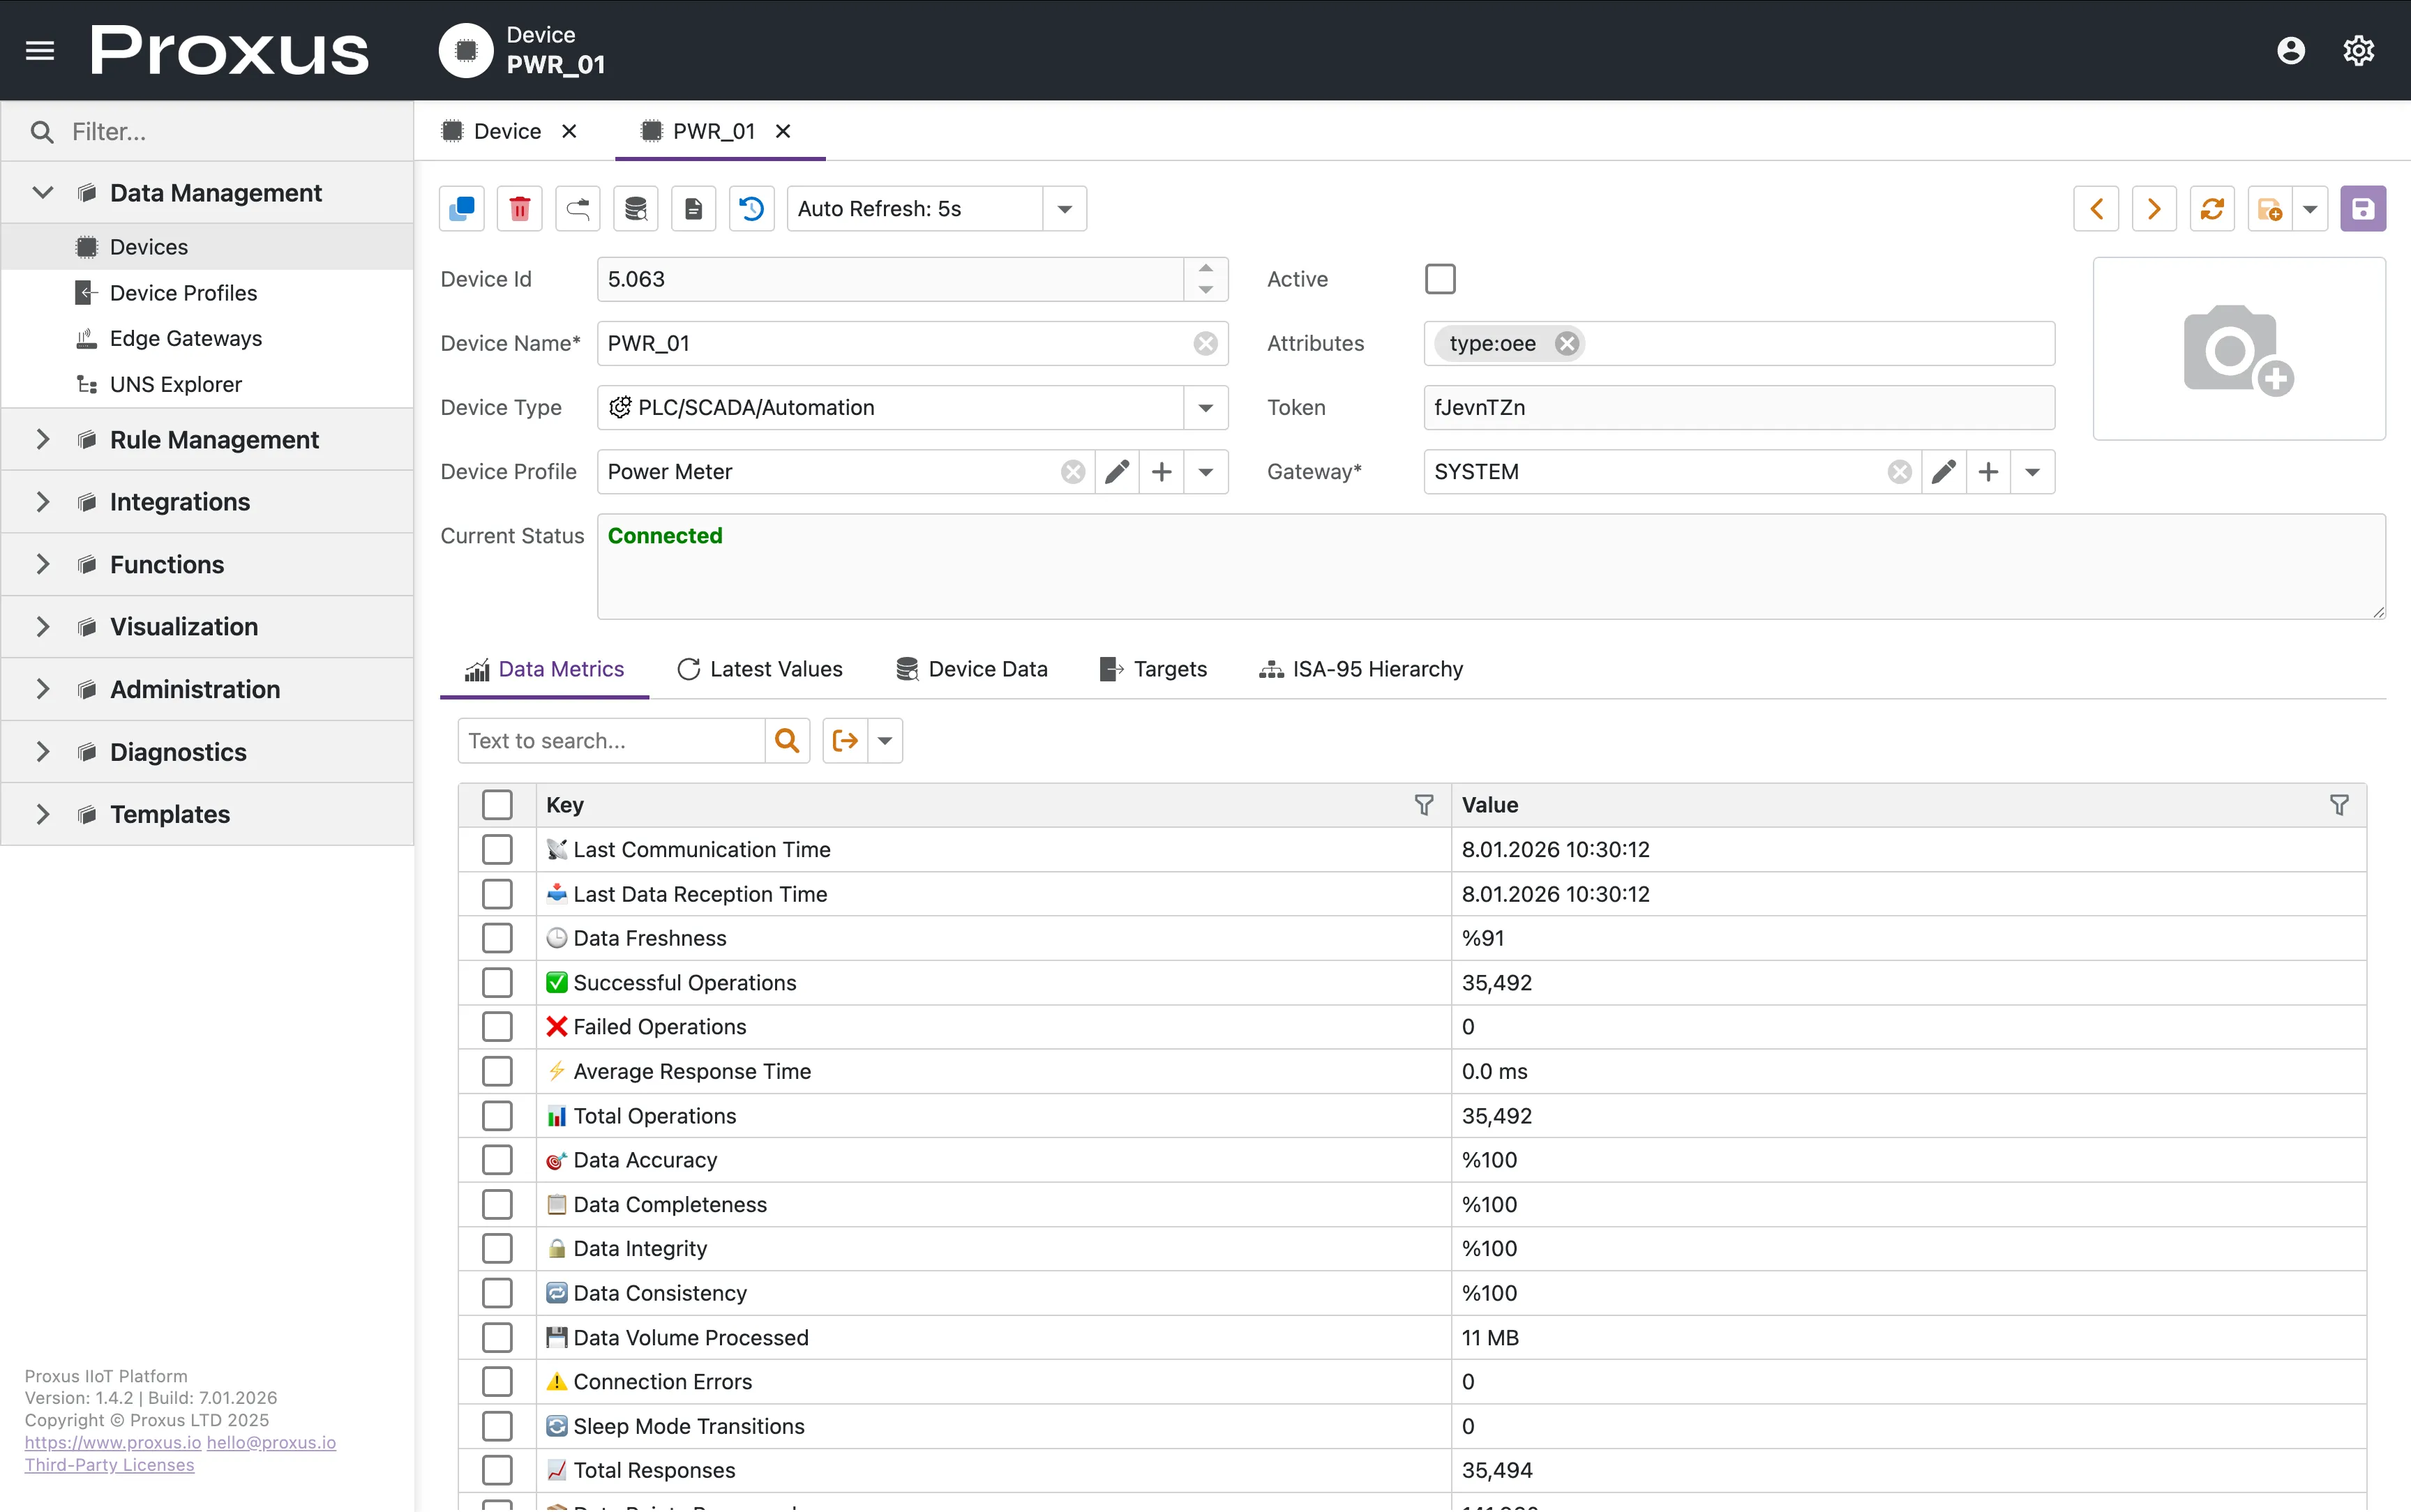
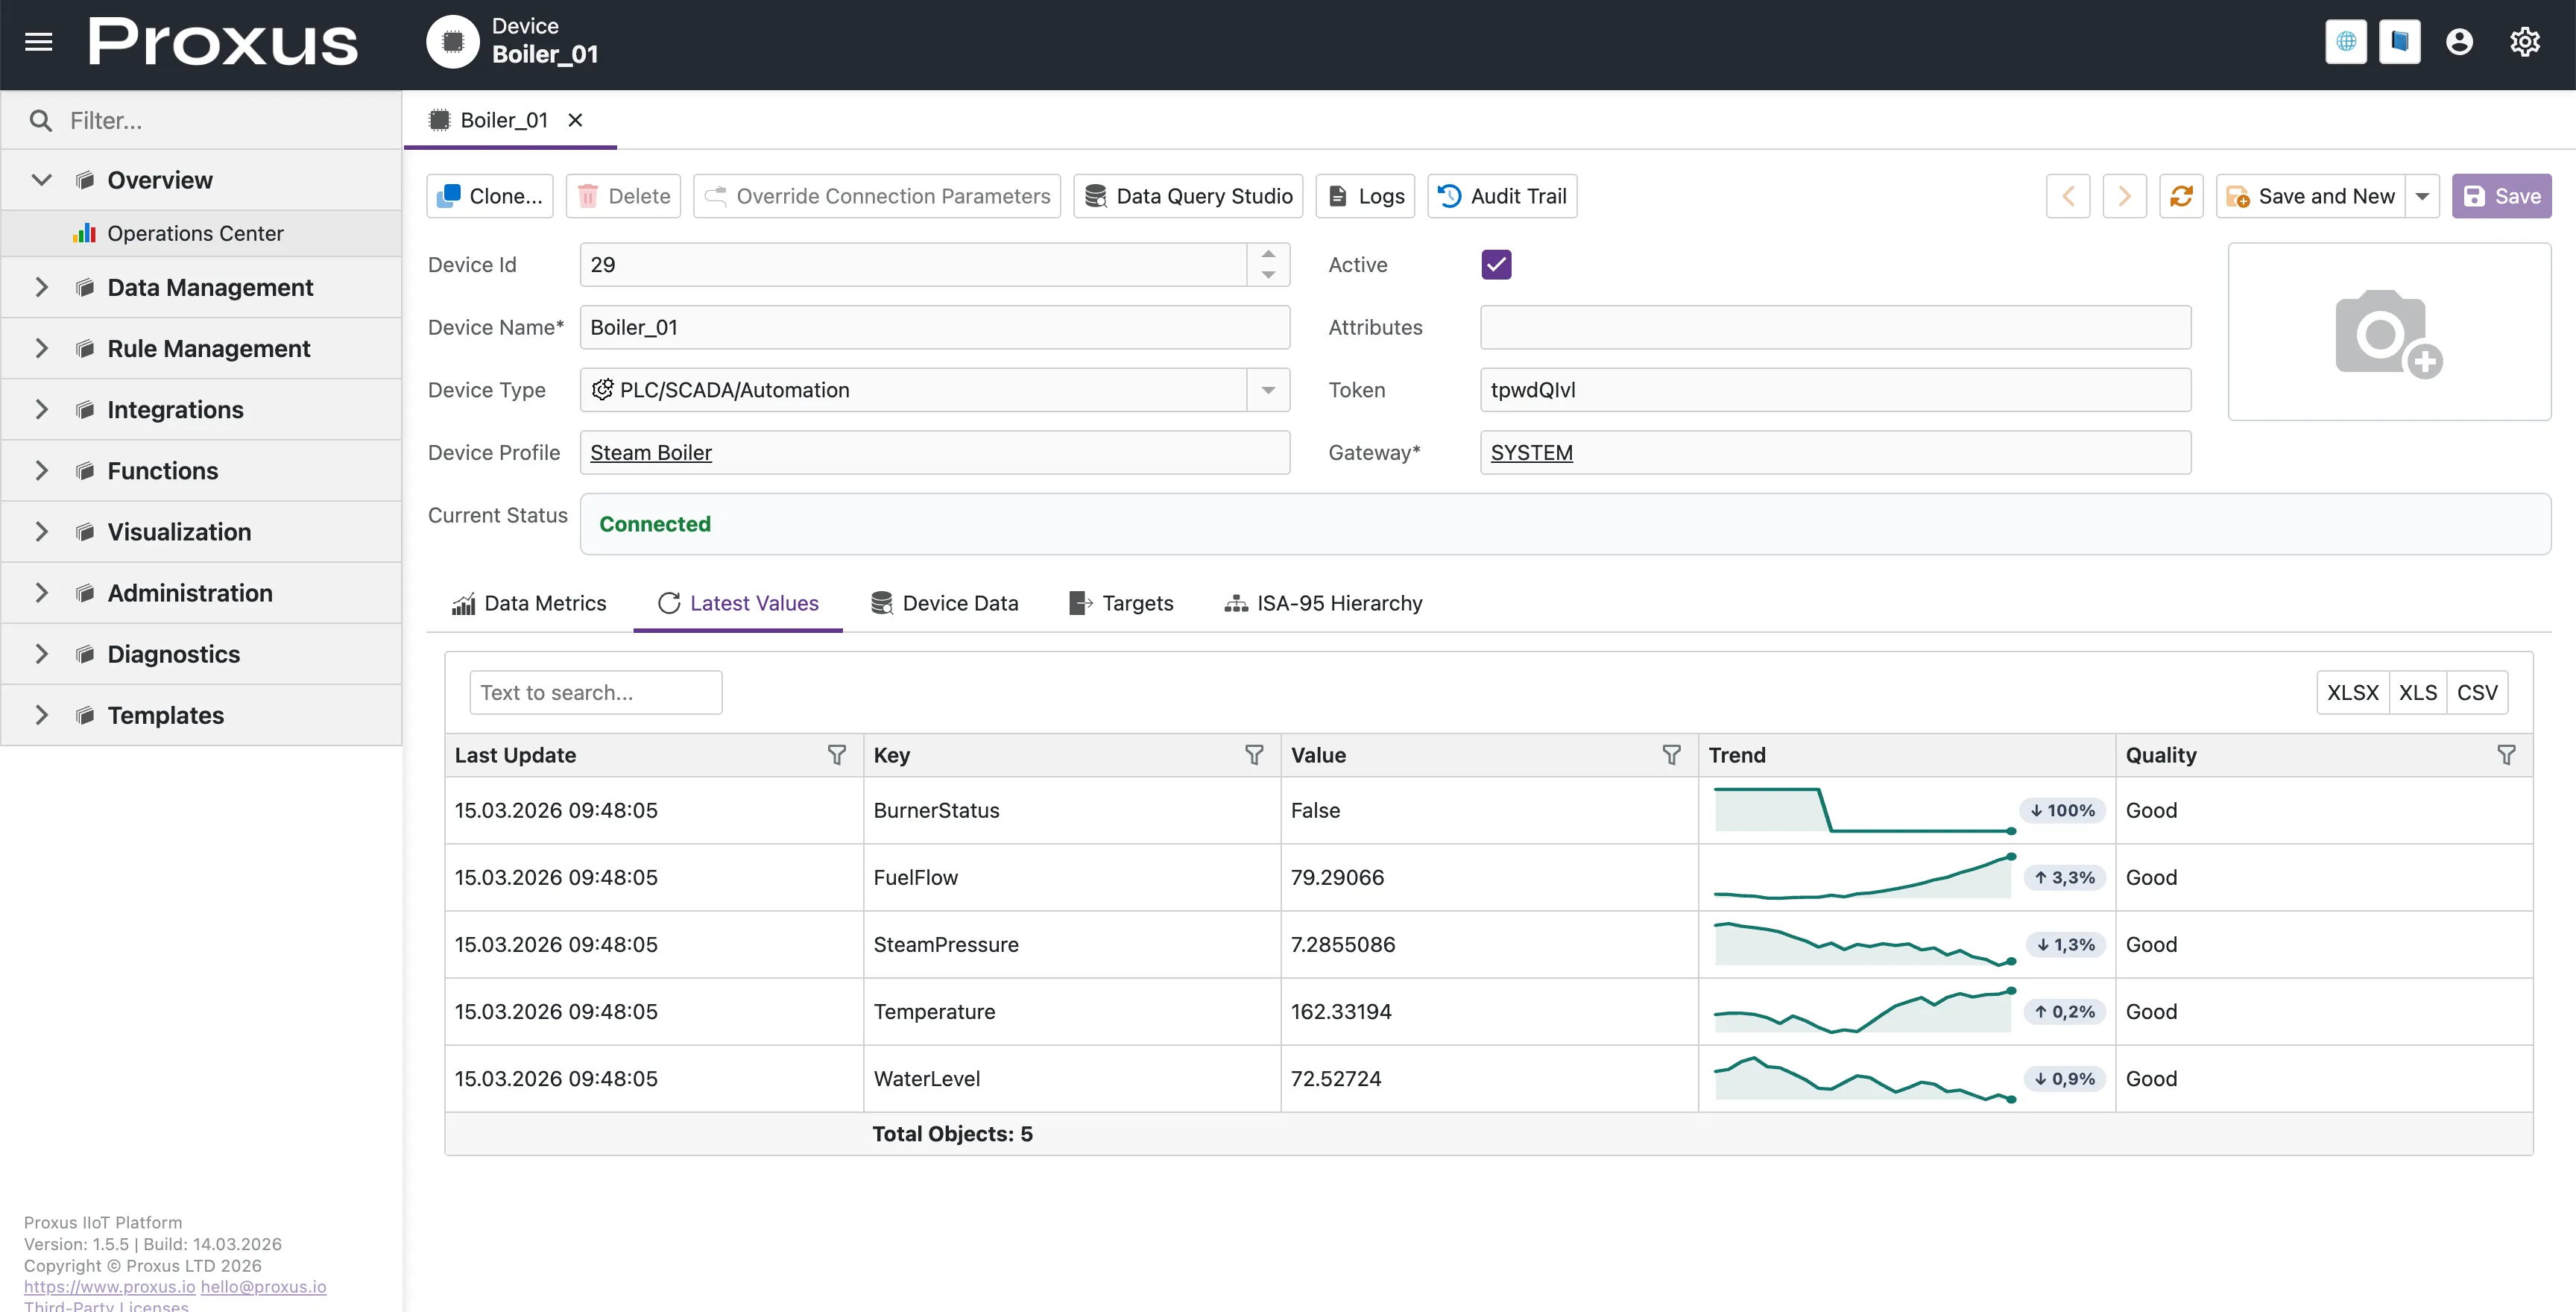
At the top of the page, you manage the device's operational state:
- Active Checkbox: Starts or stops data collection. Changes apply to the Gateway immediately.
- Current Status: A live connection indicator that refreshes while the page stays open.
- 🟢 Connected: Normal operation.
- 🛌 Sleep Mode: Device is active but outside of scheduled operating hours.
- ⚠️ Error: Connection issues or timeout. See System Logs for technical details.
- 🌐 Gateway Offline: The parent Edge Gateway is unreachable.
- Context Actions: Audit, logs, cloning, and connection overrides stay available without interrupting monitoring.
Overriding Connection Parameters
While Device Profiles define default settings like ports and timeouts, some devices need their own configuration, such as a PLC on a different IP or a specific Station ID.
To override these settings:
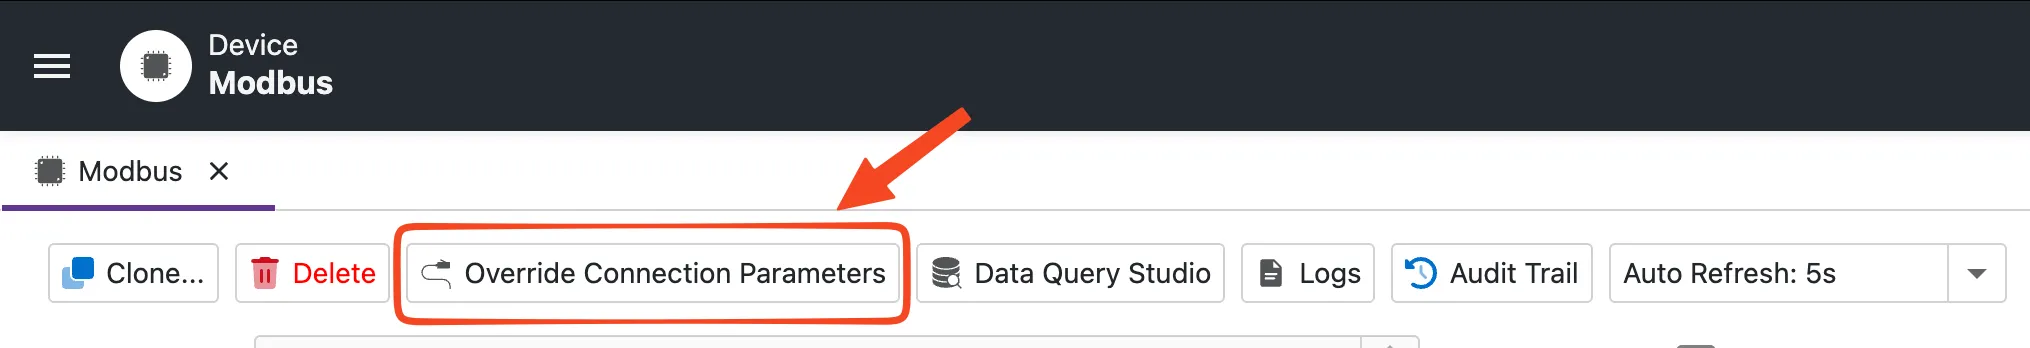
- Click the Override Connection Parameters button in the header.
- A popup will appear showing all available parameters for the selected protocol.
- Modify the necessary fields (e.g.,
Host,Port,Station). - Click Save.
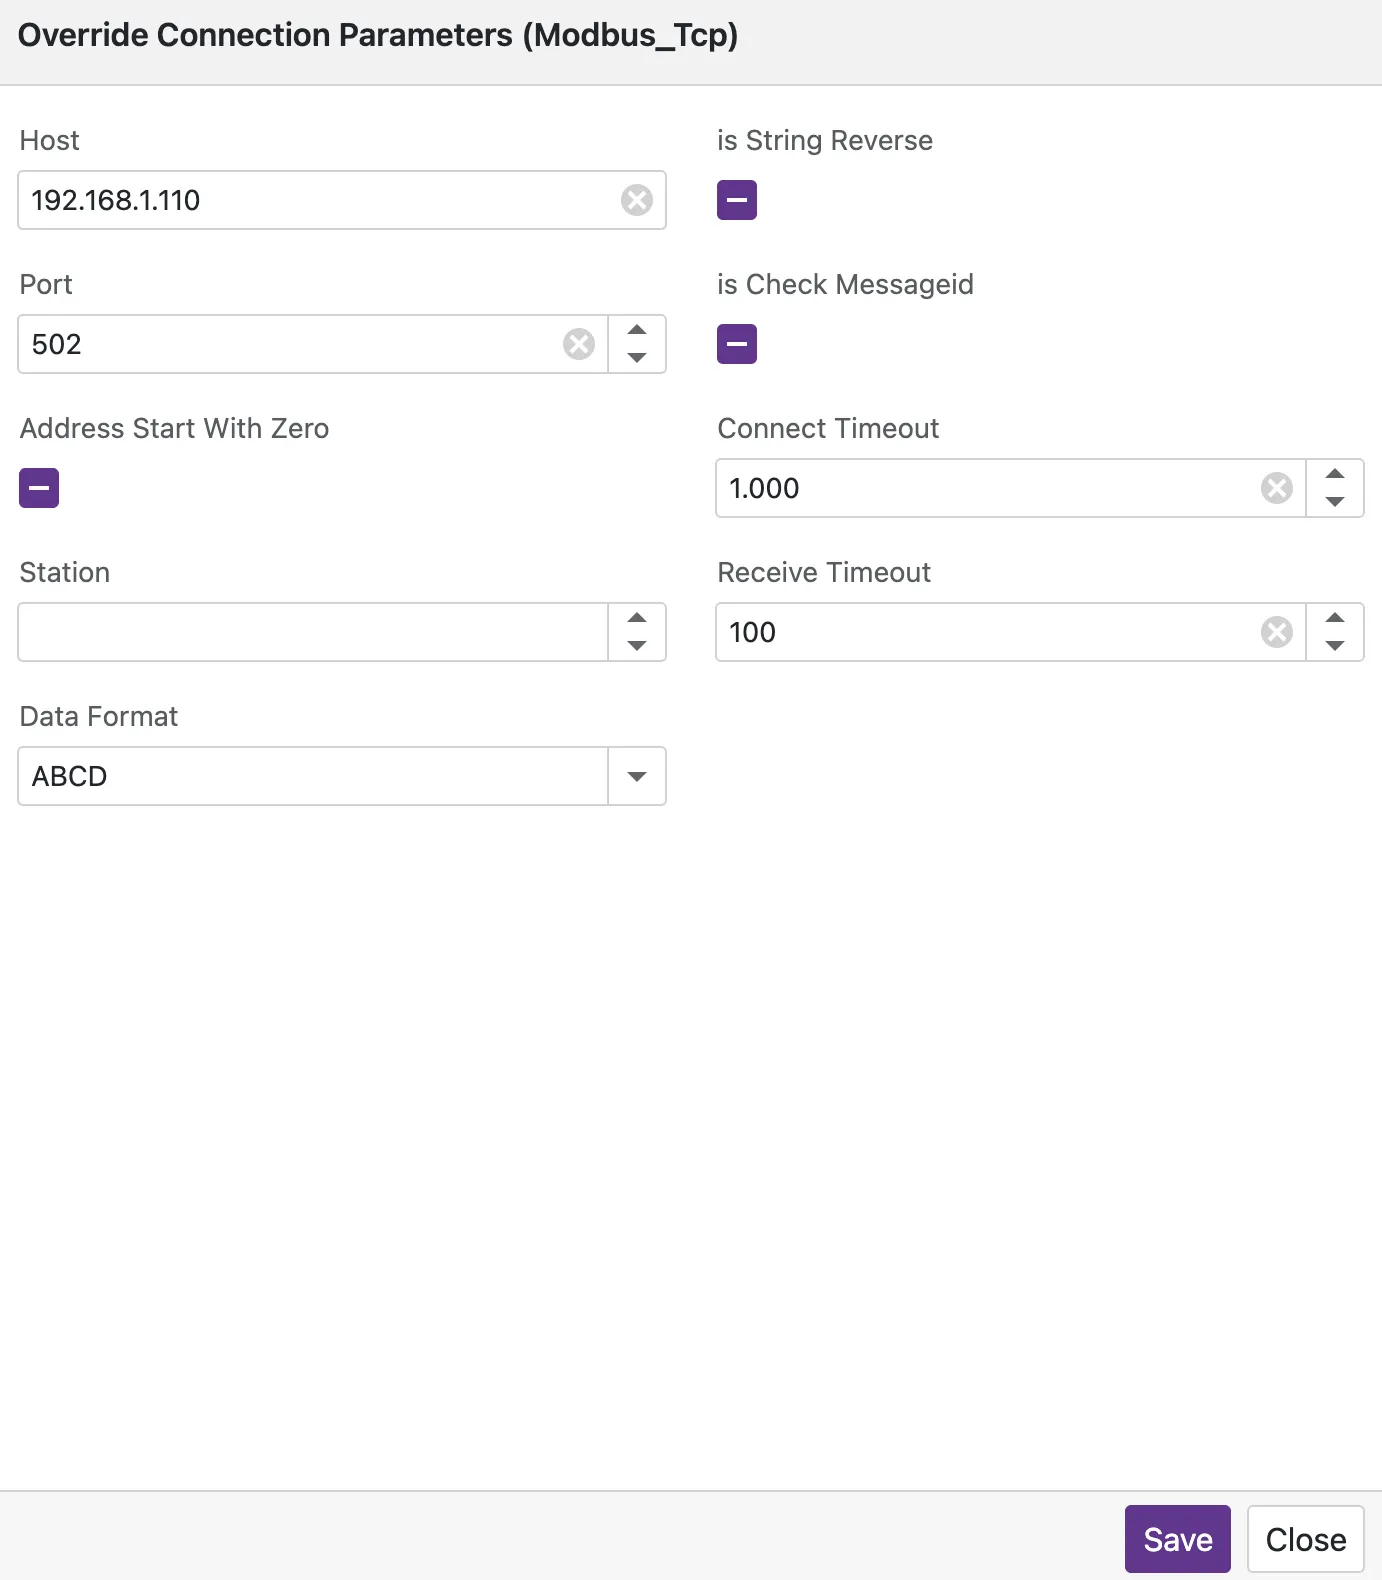
Saving overrides restarts the protocol driver on the Edge Gateway so the new settings take effect.
Data Metrics
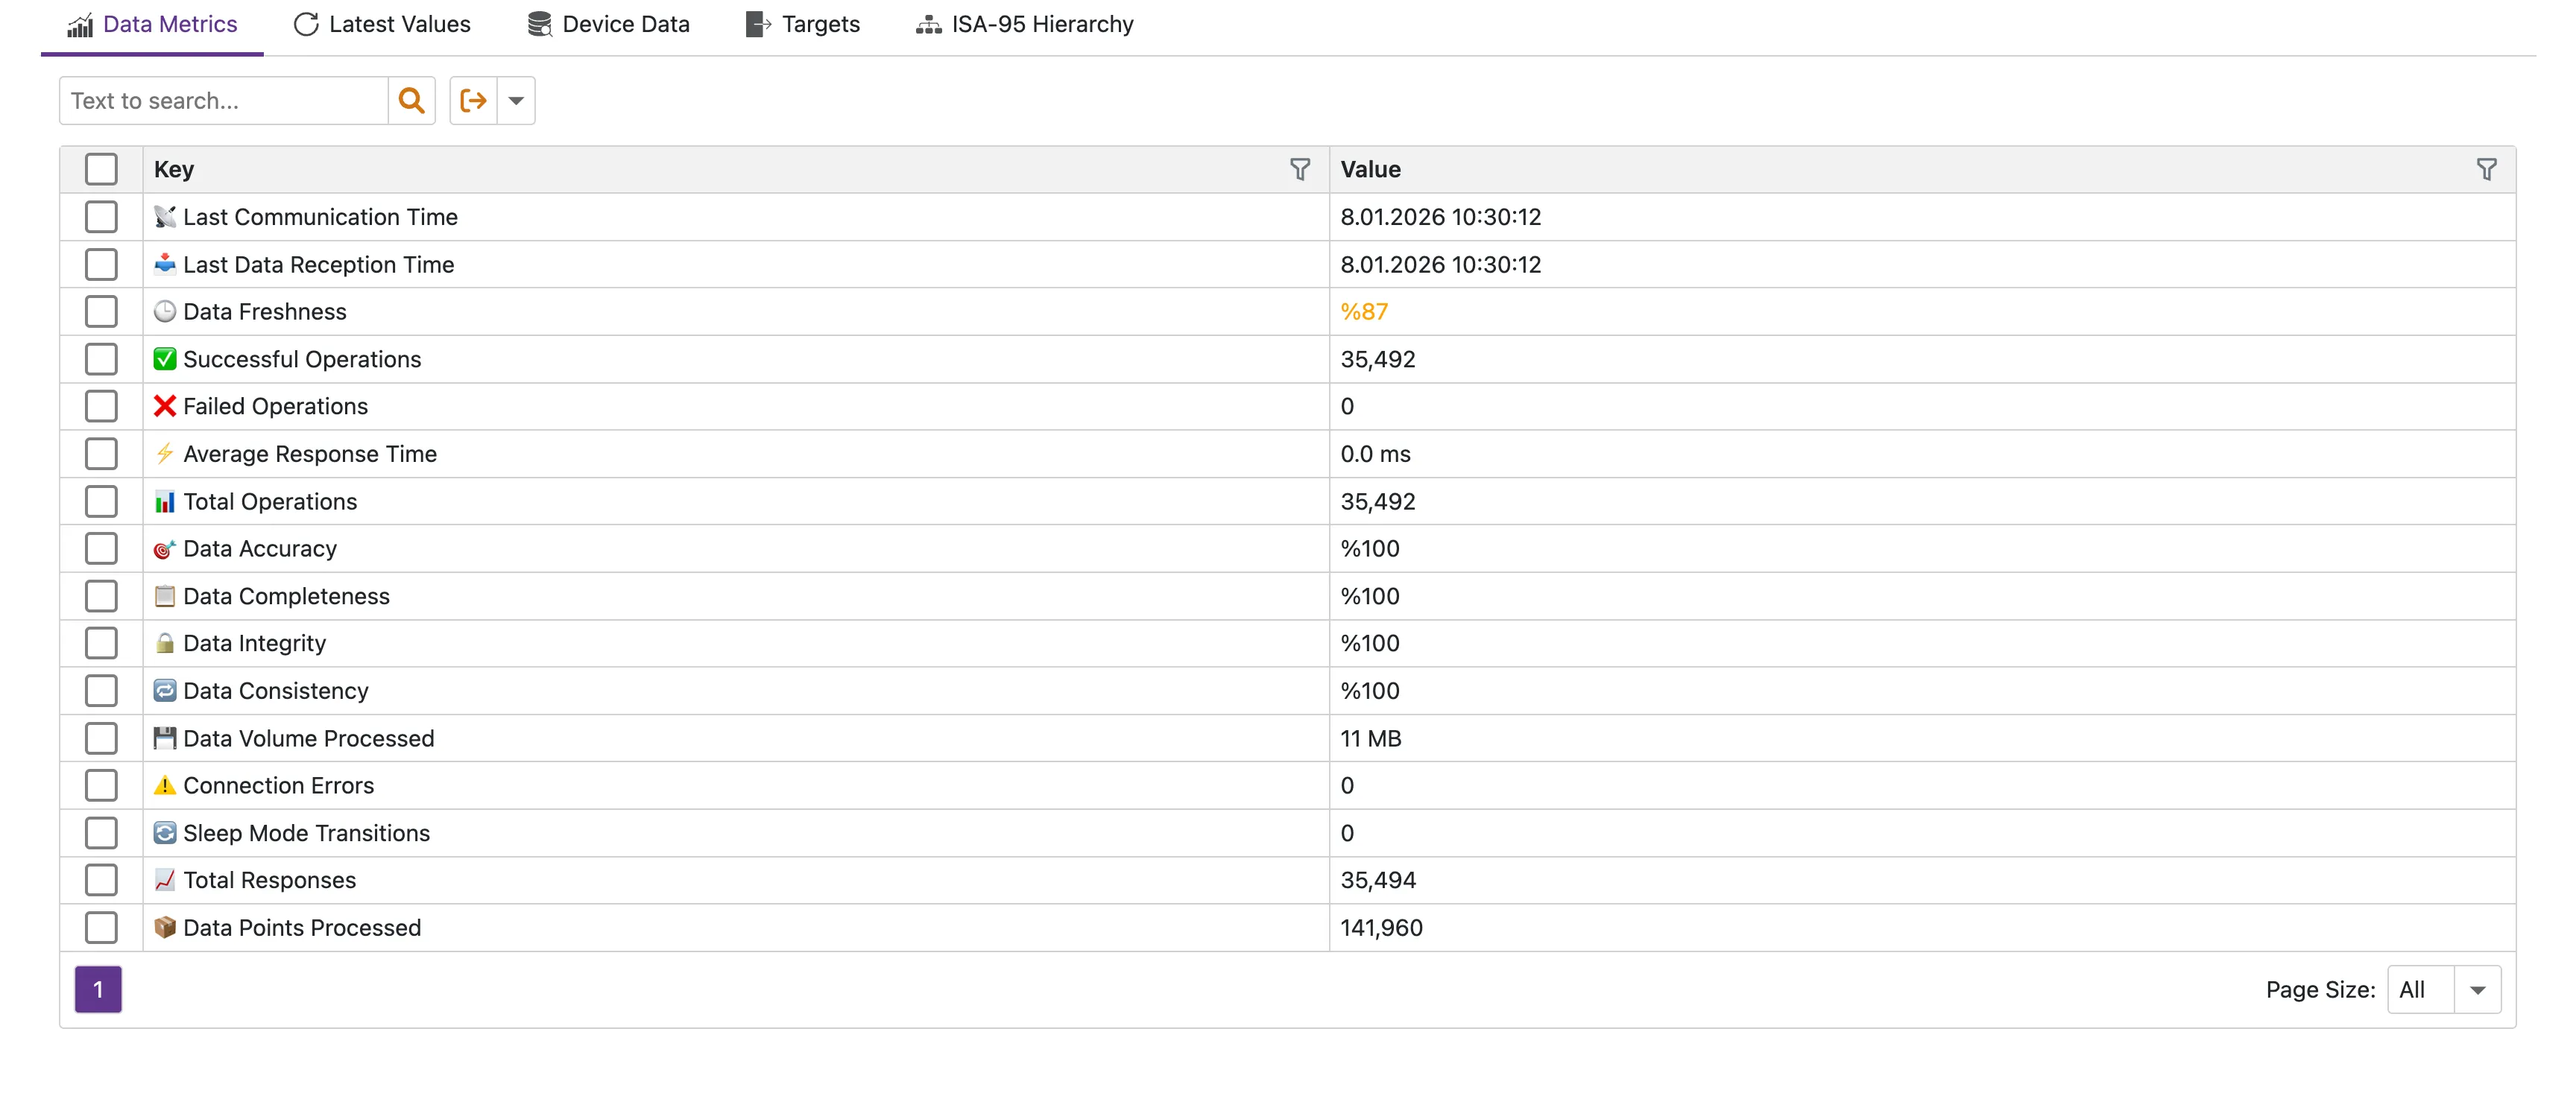
The Data Metrics tab is a live health check for the physical connection. It aggregates counters from the protocol driver and refreshes automatically as new telemetry arrives.
| Metric | Description |
|---|---|
| Data Freshness | Percentage of successful reads in the last window. Should be near 100%. |
| Response Time | Average round-trip time (RTT) to the PLC/Device. |
| Success/Failed Ops | Total count of read/write operations since the last reset. |
| Sleep Mode Transitions | How many times the device entered power-saving mode. |
Latest Values
This tab shows the newest value for every tag defined in the Device Profile. It gives you the machine's current state at a glance and updates while the page stays open.
Live Updates
Runtime updates follow an event-driven flow:
- Edge to Central: The Edge Gateway continues sending telemetry and runtime metrics according to the device and protocol configuration.
- Central to UI: The detail page subscribes to live runtime updates and refreshes the visible data sections without a full page reload.
This means Current Status, Data Metrics, Latest Values, and Device Data stay current while the operator remains on the page.
Trend Preview and Drill-Down
Each numeric signal in Latest Values includes a compact inline trend preview. That makes recent movement easy to spot without leaving the grid.
- Inline trend preview: A small chart gives quick visual context for the most recent movement of the signal.
- Trend direction summary: The trend cell highlights direction and recent percentage movement without implying whether the change is good or bad.
- Click-to-open detail: Selecting the trend cell opens a fullscreen signal view for deeper investigation.
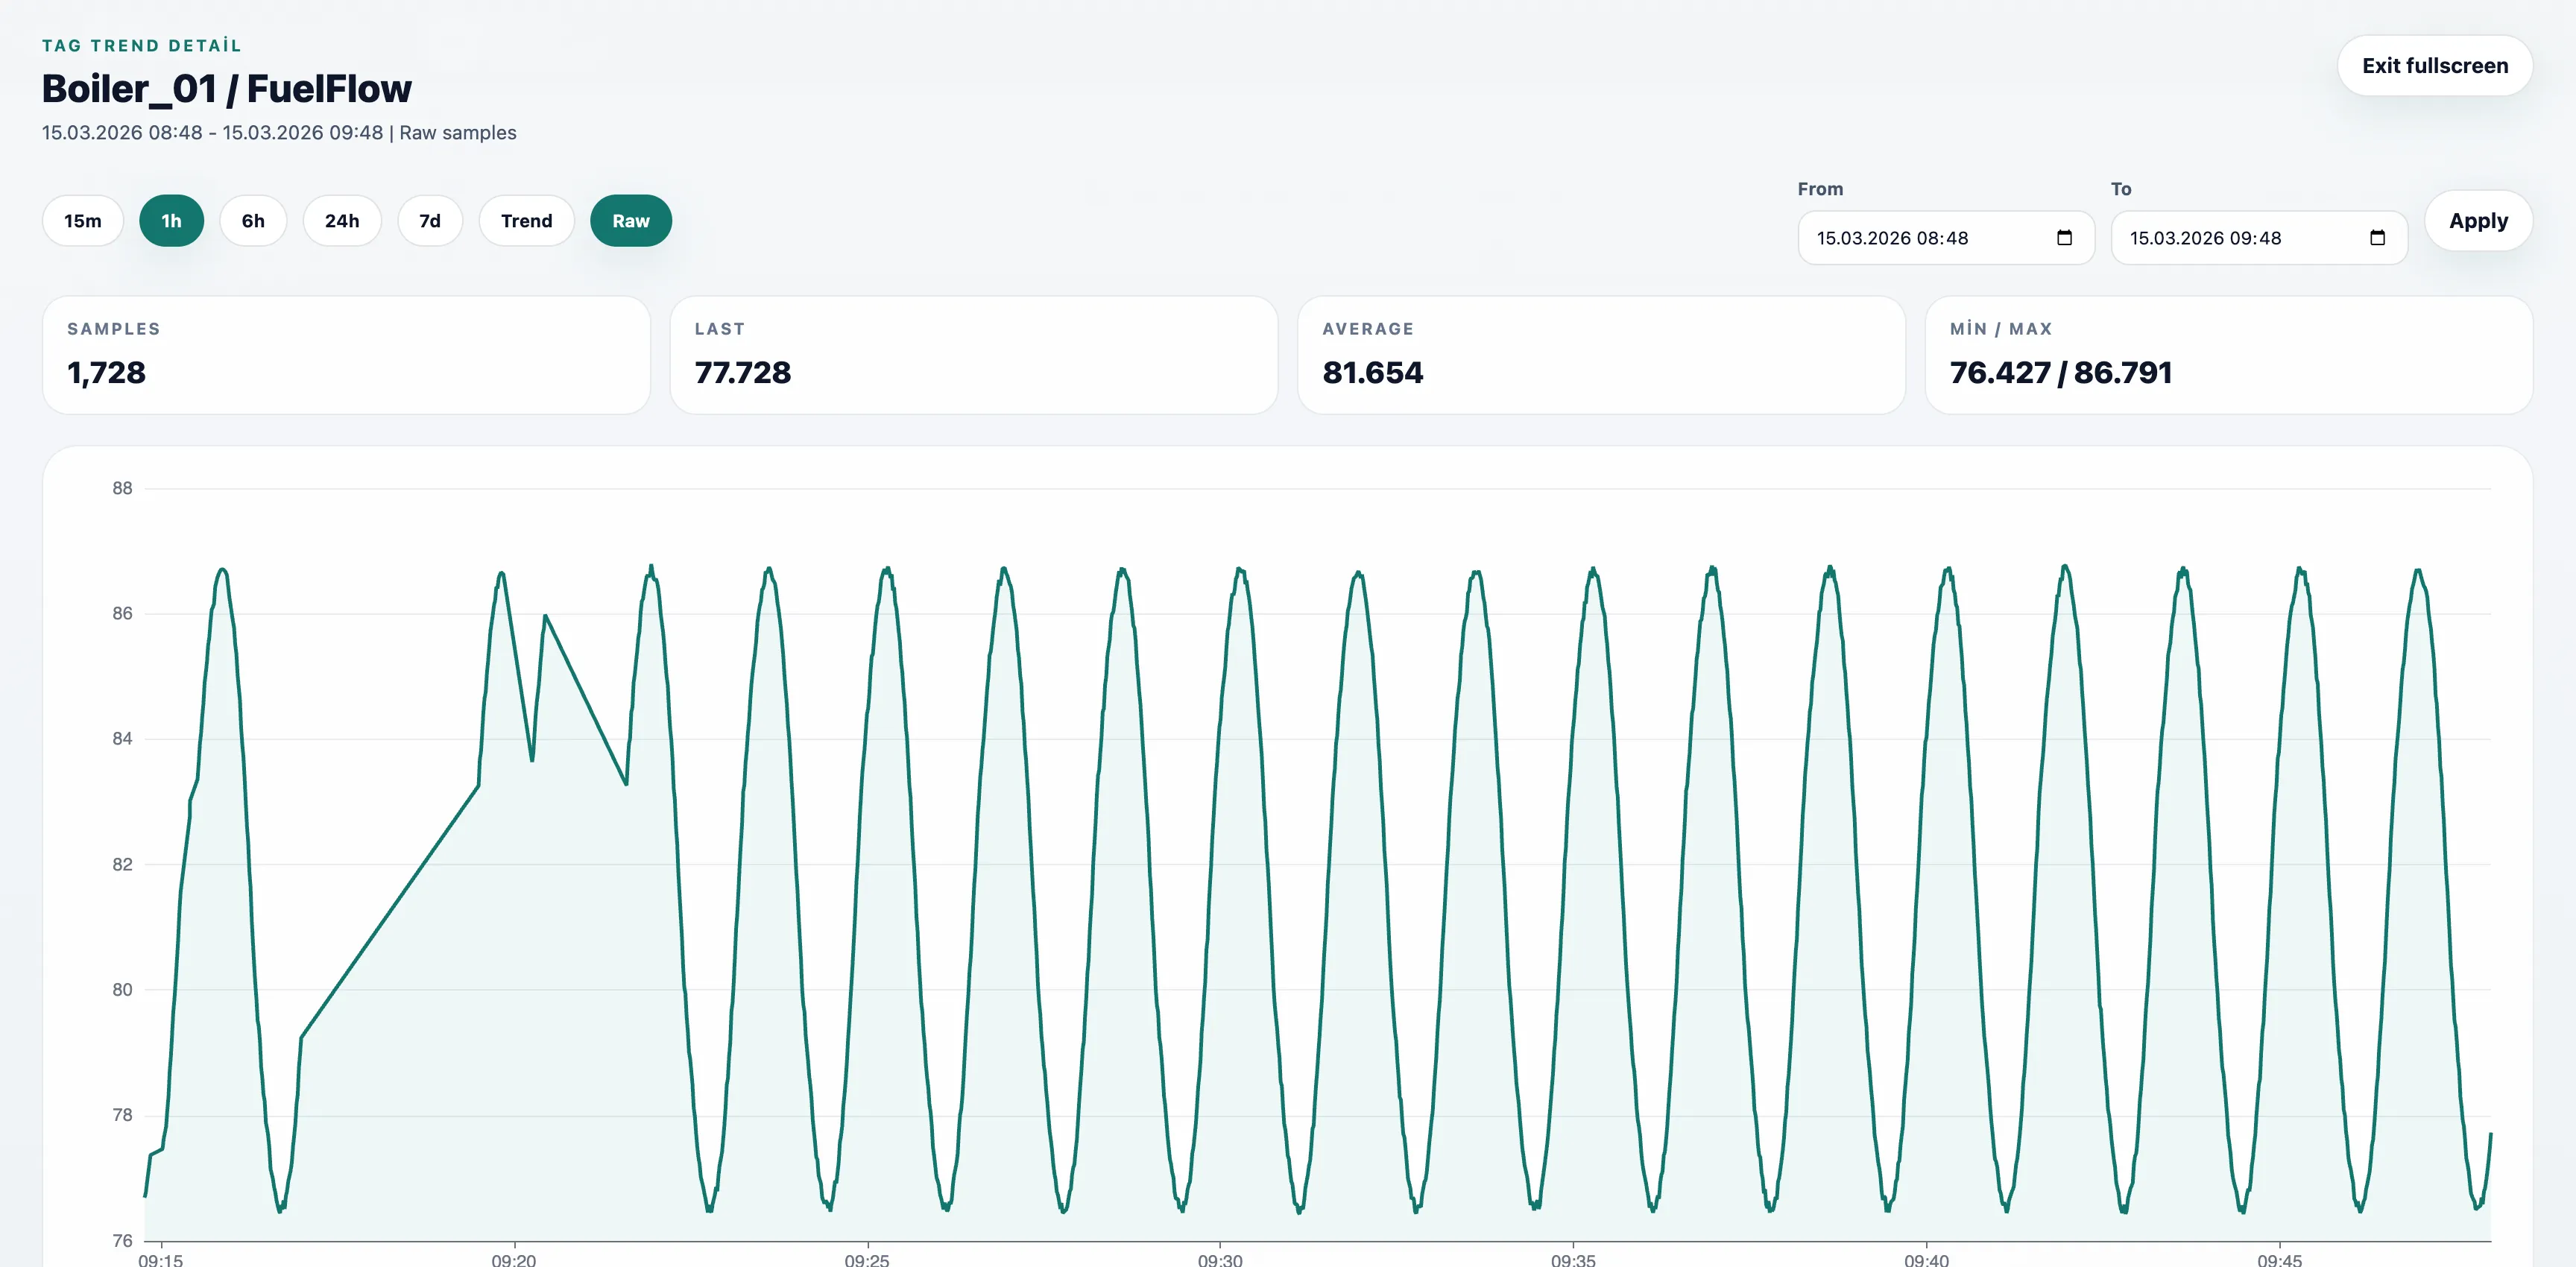
In the fullscreen view, operators can:
- switch between quick ranges such as 15m, 1h, 6h, 24h, and 7d
- apply a custom From / To range
- compare Last, Average, Min / Max, and Samples
- switch between Trend mode for historical downsampled analysis and Raw mode for short-interval inspection
Raw mode is intended for close inspection of higher-frequency behavior and currently supports up to 1 hour per request.
Tag Quality and Error Isolation (v1.5.3)
Starting with v1.5.3, read behavior is quality-aware at tag level:
- Good: Tag value was read successfully.
- Bad: Tag-level read error occurred, but the device read cycle continues for other tags.
- Uncertain: A repeatedly failing tag is temporarily disabled and retried periodically.
This prevents one invalid or unstable tag from stopping all telemetry for a device.
Connection reliability decisions are also stricter:
ProtocolErroris treated as connection-level by default.- Only clearly tag-scoped protocol errors are isolated at tag level.
In practice, real communication/session failures are less likely to be masked as tag errors.
For sub-second changes, use the fullscreen Raw trend mode or the Device Data tab. Both provide a more detailed view than the Latest Values grid alone.
Configuration Settings
The following settings in Proxus-config.toml control the behavior of this view:
| Setting | Default | Description |
|---|---|---|
DeviceDataTimeRange | 1h | The time window of historical data kept in the UI cache. |
MaxDeviceDataLoad | 1000 | Maximum number of data points loaded per request. |
DeviceMetricsTransmissionInterval | 10s | How often the Edge sends health and performance metrics. |
For a complete list of all system settings, see the Configuration Reference.
To ensure platform stability, internal UNS updates are throttled at 500ms per metric. This prevents UI lockups during massive high-frequency data bursts.
Device Data (History)
The Device Data tab shows the raw packet stream from the device. It updates live while the page remains open and is useful for debugging protocol issues or verifying ingestion.
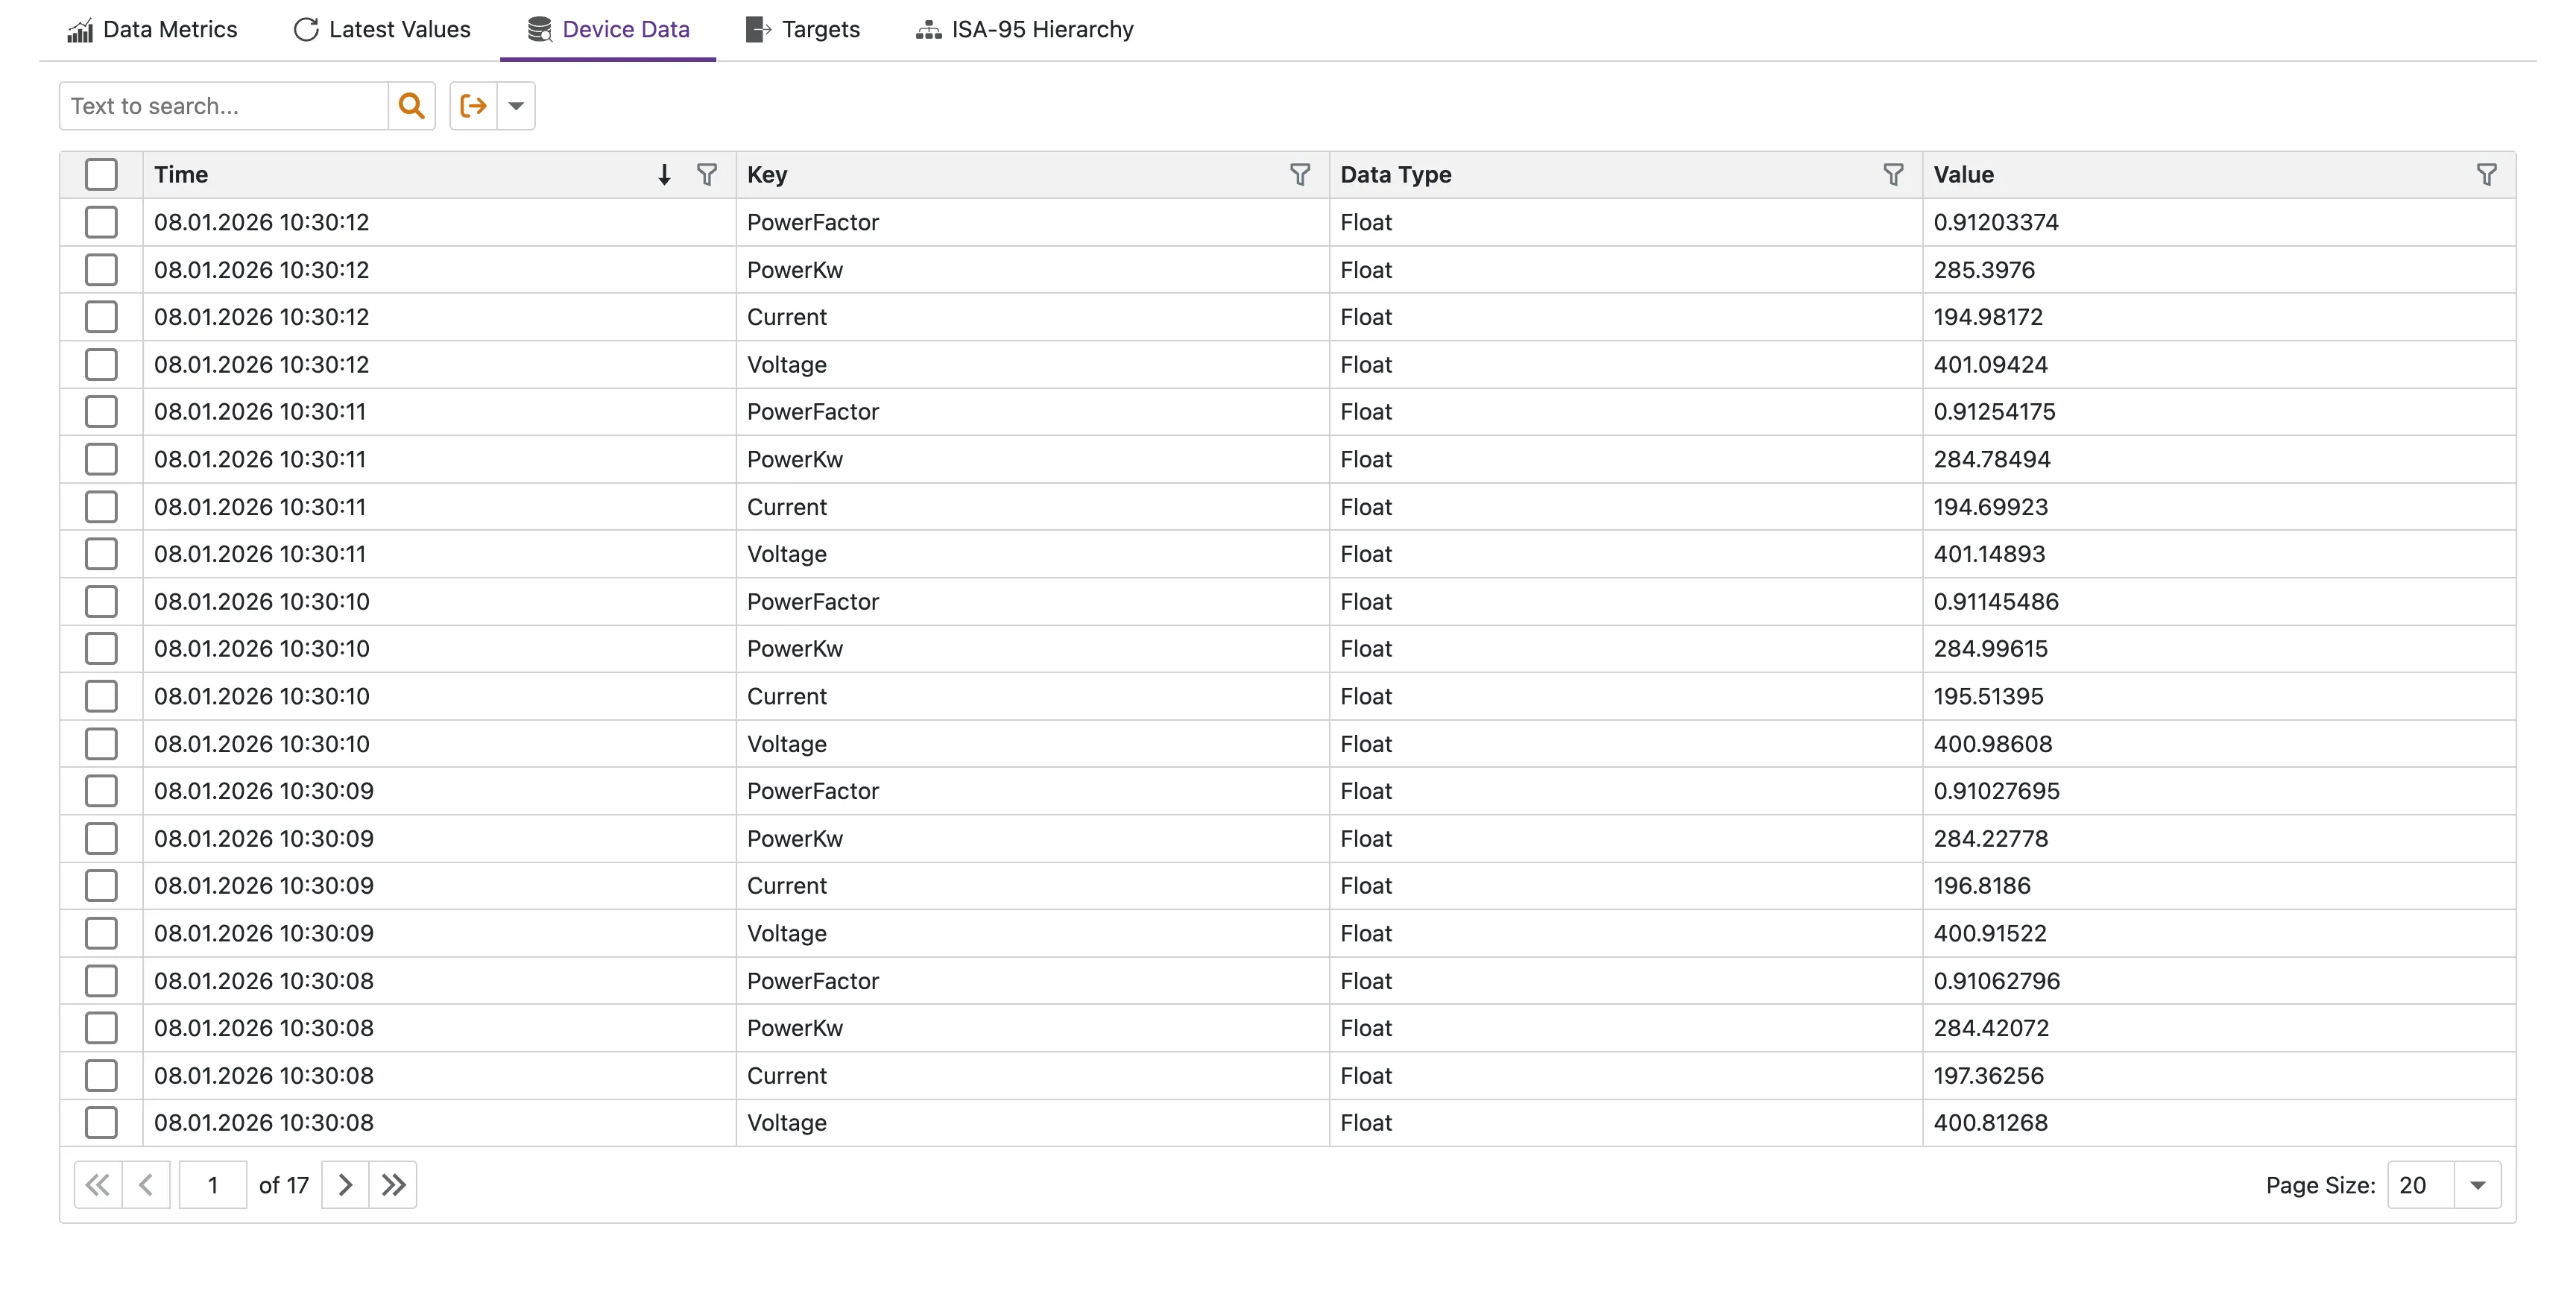
- Incoming: The raw value received from the device.
- Timestamp: The exact time (UTC) the data was timestamped at the Edge.
- Quality: Per-tag read quality (
Good,Bad,Uncertain) for operational troubleshooting.
Targets
Manage where the data flows. By default, every device writes to the System Internal DB (ClickHouse). You can add external Targets like AWS IoT, Kafka, or MQTT brokers here.
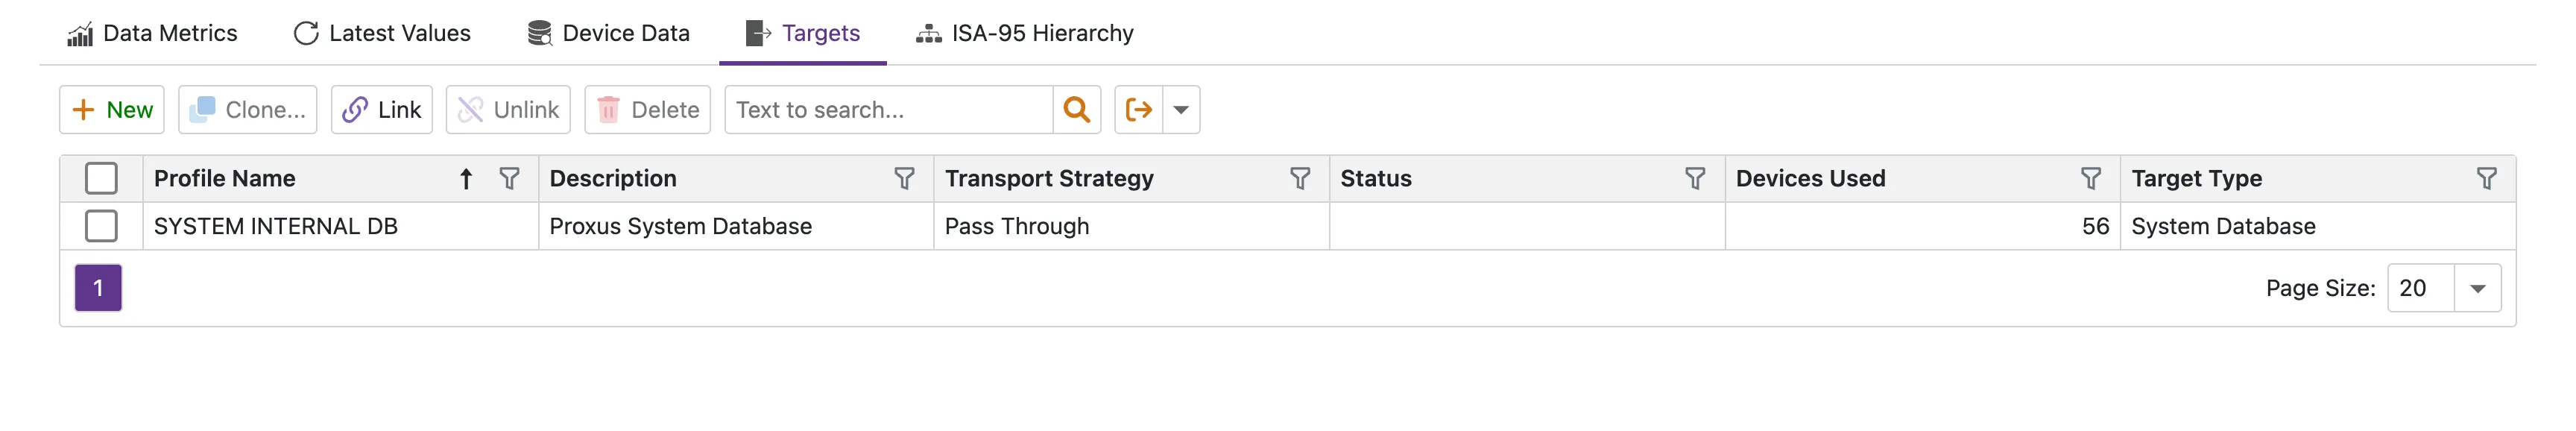
Transport Strategy
Each target has a Transport Strategy that controls how data is forwarded:
- Pass Through: Sends every data point to the target (best for full fidelity storage).
- On Change: Sends only values that changed (reduces bandwidth for high-frequency tags).
Choose the strategy per target based on bandwidth and storage requirements.
ISA-95 Hierarchy
This tab defines where this device fits in your organizational model.
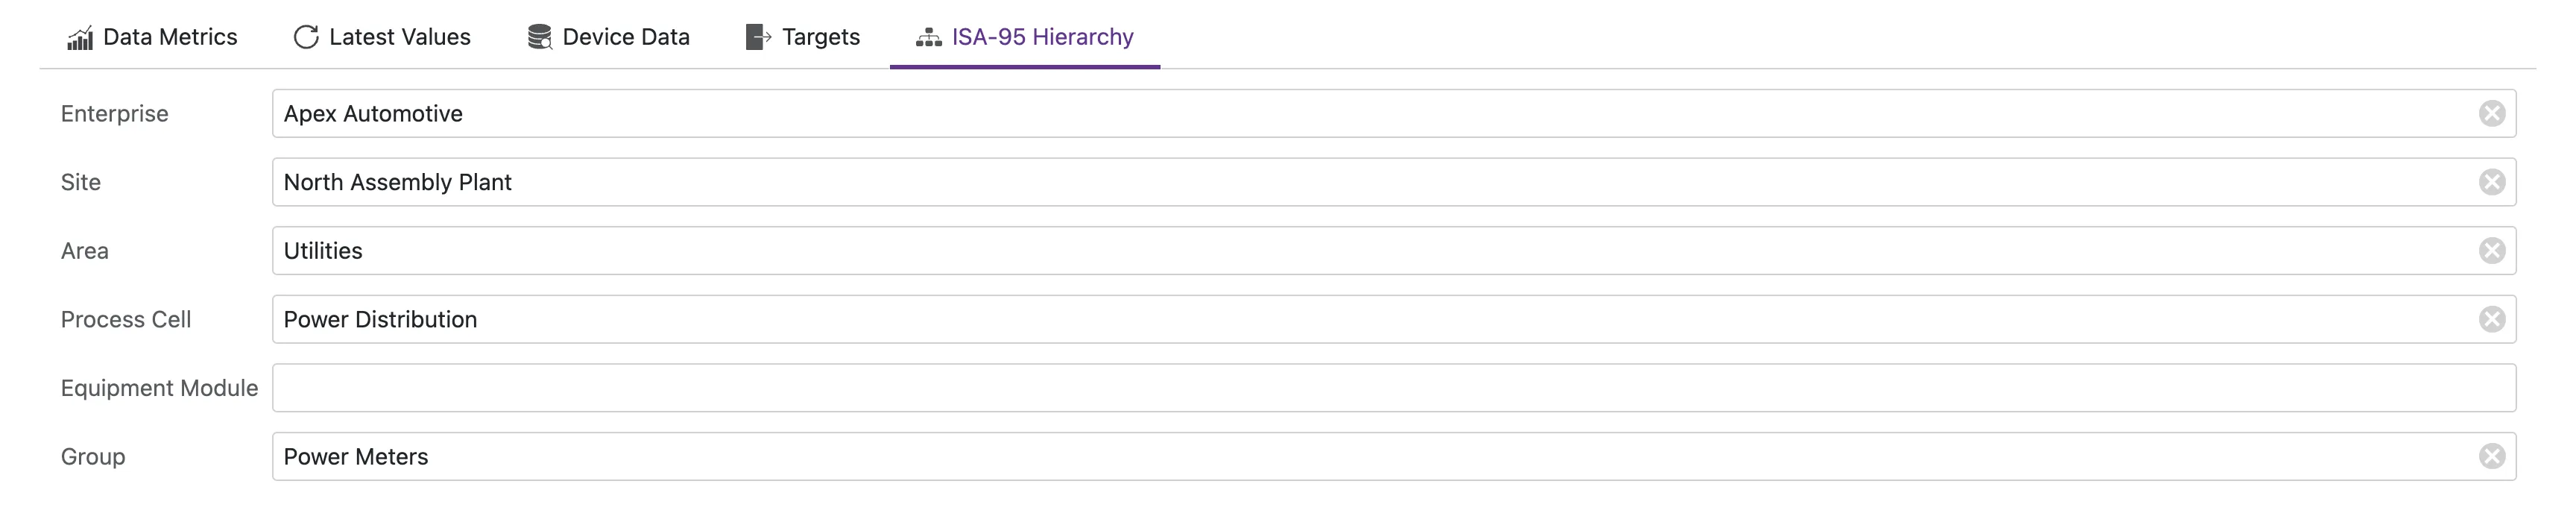
- Enterprise: The top-level organization.
- Site: Physical location (e.g., "New York Plant").
- Area: Production area (e.g., "Assembly Line A").
- Process Cell: Logical grouping (e.g., "Welding Station").
Setting these values enables hierarchical filtering in Dashboards and UNS (Unified Namespace) Topic Generation.