Cloud and data warehouse feeds
Feed your data platform from the plant, and see that nothing is missing.
Is every minute from every machine reaching your data platform, and how would you know if it was not?
Proxus reads your machines, holds the data in the plant when the link drops and delivers it to your cloud services, data lake, warehouse or message broker. One screen shows, source by source and hour by hour, what arrived and where a gap is, so your data team checks the feed instead of guessing.
The live demo opens in your browser with your name, company and work email. Nothing to install.
Pricing from $5,500 a year- 15+ destination systems
- Up to 30 days of buffering at the edge
- Unlimited users and dashboards
Running every day at these plants.See deployments


On the screen
The three questions a data team asks about a plant feed.

Is every source complete?
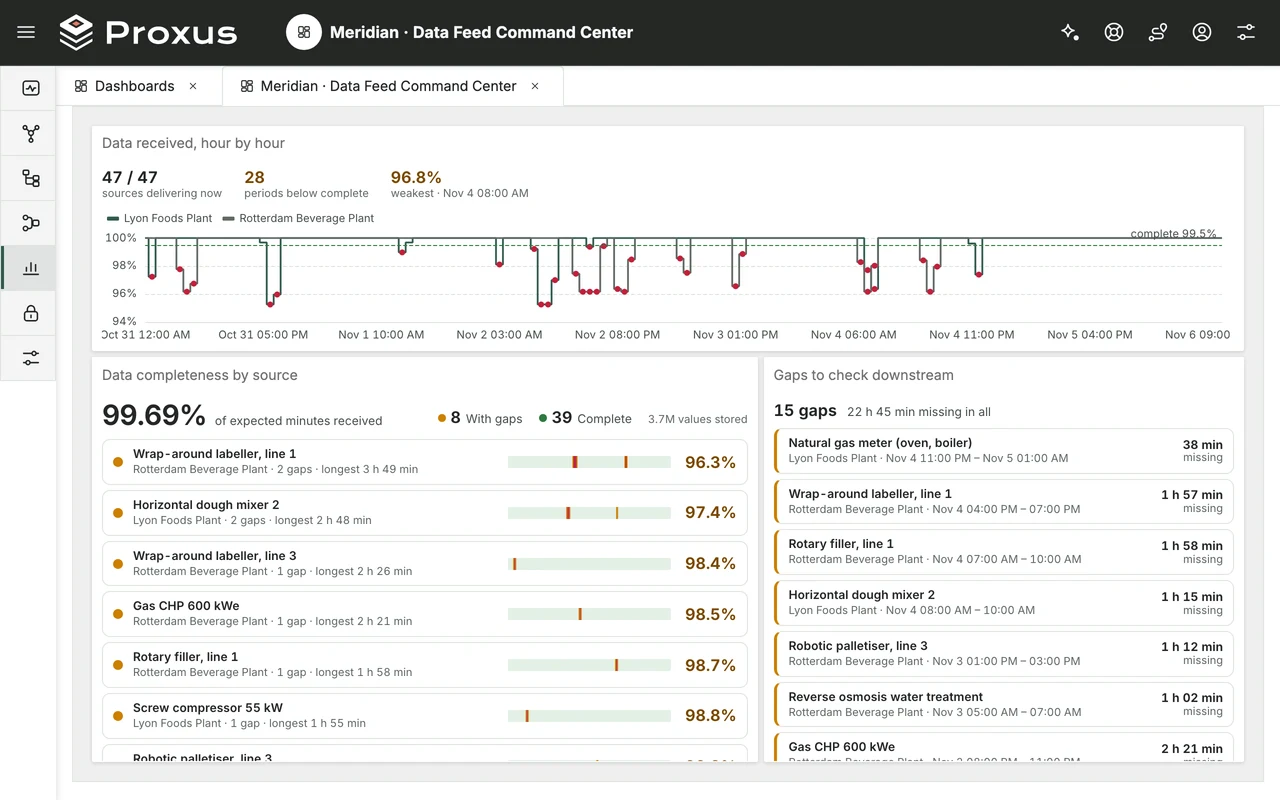
Every machine and meter as a row, the weakest first: the share of its minutes that arrived, a strip of its hours with every gap in red, and whether it is silent right now. One click narrows the screen to that source.
- Completeness per source, weakest first
- Every hour of the week at a glance
- Sources that stopped sending, flagged

Where are the gaps, and how long were they?
The share of expected minutes received, hour by hour for each plant, with the weak hours marked and the sources behind every dip named. Beside it, every gap with its start, its end and the minutes missing, newest first: the windows to check downstream.
- Hour-by-hour completeness per plant
- The sources behind every dip
- Every gap with start, end and minutes missing

Is every target delivering?
The targets in use and every destination Proxus ships with: databases, message brokers, cloud services and REST. Each target shows whether it delivers, when it last succeeded and failed, the last error, and what is waiting in each Edge Gateway’s queue.
- Status, last success and last error per target
- Records waiting in each Edge Gateway’s queue
- 15+ destination systems built in
Try these screens yourself, in your browser.
The same feed status on the data team’s laptop, the IT lead’s tablet and the on-call engineer’s phone.
Open the live demoThe live demo opens in your browser with your name, company and work email. Nothing to install.
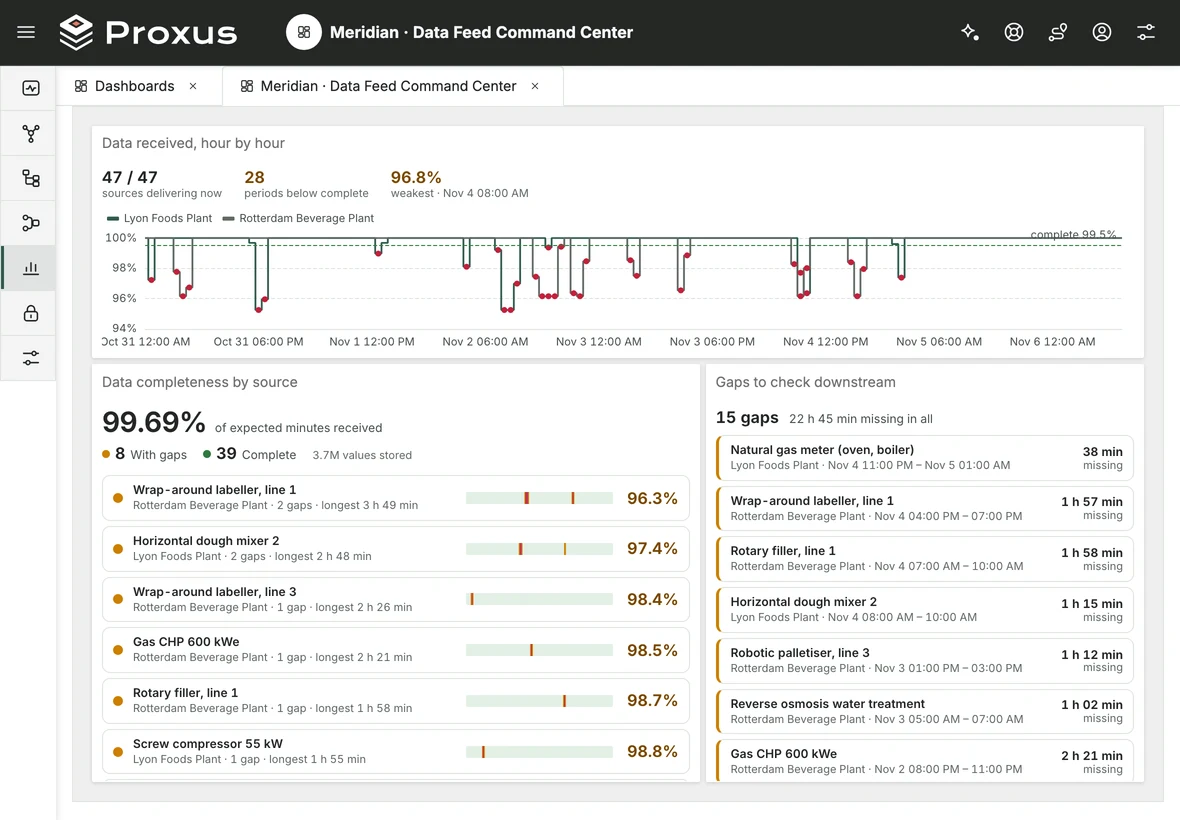
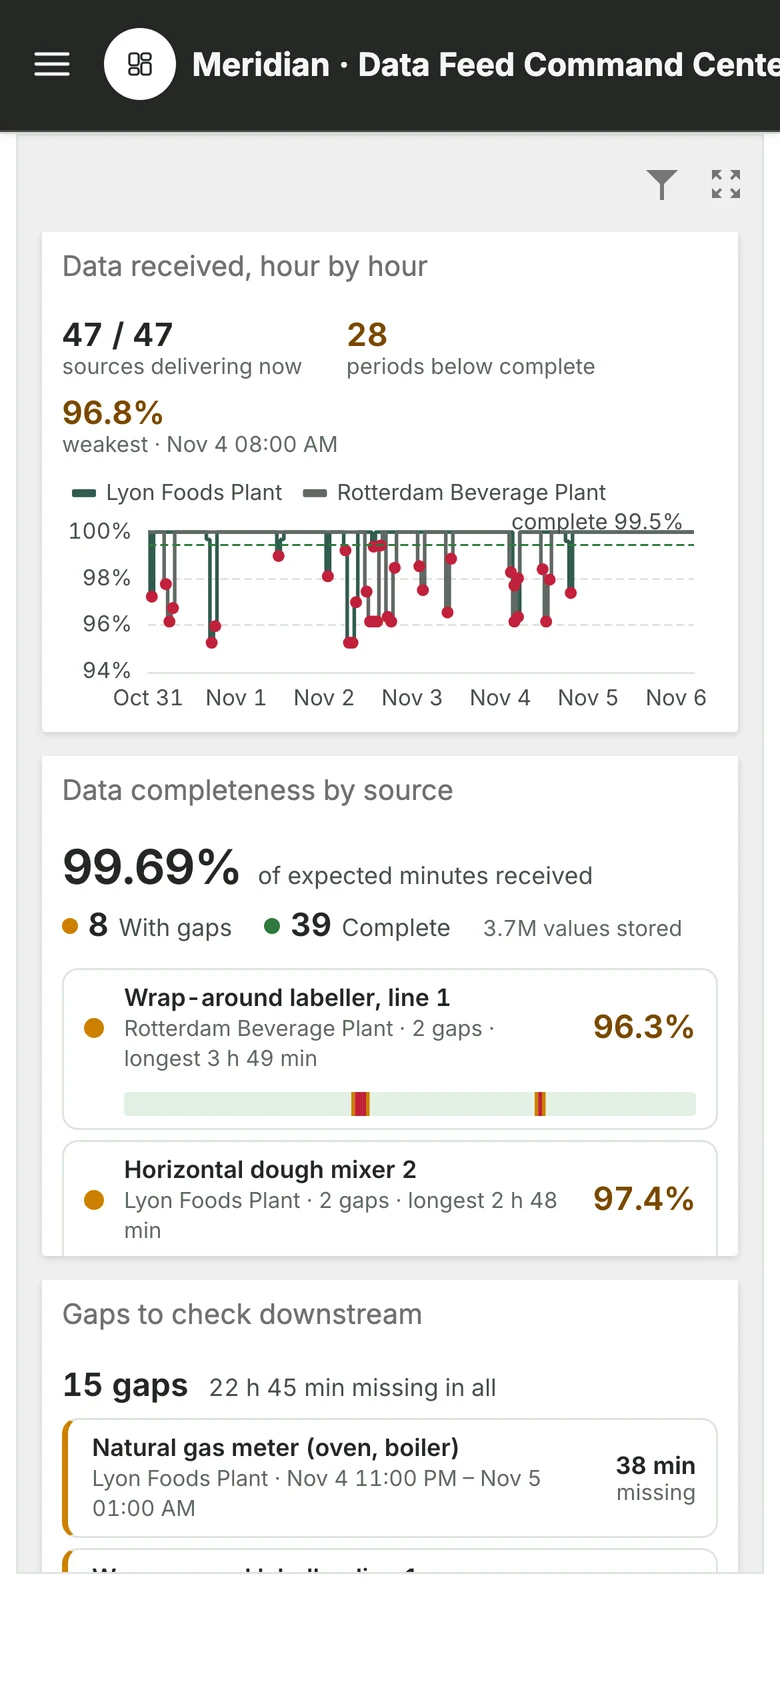
Real Proxus screens; the machine data shown is simulated.
In your estate
A configured feed, not a pipeline project.
-
Cloud, lake and warehouse
AWS IoT Core, Azure IoT Hub, Azure Data Lake Storage Gen2, ClickHouse, InfluxDB and the common SQL databases, each set up as a target, not written as code.
-
Streams and APIs
Apache Kafka, RabbitMQ, MQTT, Sparkplug B, Redis and REST endpoints for the systems that consume events.
-
Nothing lost when the link drops
Each Edge Gateway keeps what it could not deliver, 48 hours by default and up to 30 days, and sends it in order once the target is back.
-
Files your data team can use
Data lake files in Parquet, CSV or JSON Lines, in folders by date and hour. Each record carries the device, the signal, its value and its timestamp.
-
You choose what goes where
Each device sends to the targets you pick: the plant’s own history, the data lake, a broker, or all of them.
-
Runs in your network
Proxus runs on your own servers in the plant or your data centre; sending to a cloud is a choice, not a requirement.
How you start
Start with one line and one target.
Pick a line whose data your analysts are waiting for and the platform it should land in. We connect the machines, set up the target and agree what a complete feed means; then the same setup moves to the other lines and plants.
- We pick the line, its signals and the target together
- The feed runs, buffered at the edge, with its completeness on screen
- The same setup moves to the other lines and plants
Starter · one Edge Gateway
From $5,500 / year
- Unlimited users and dashboards
- No per-target or per-tag fees
- Runs on your own servers
An annual licence. The price follows the number of Edge Gateways and the data capacity you choose, not machines or targets. Excluding taxes.
Request a pilot call Pricing in detail- Which platforms can it send to?
- 15+ destination systems: AWS IoT Core, Azure IoT Hub and Azure Data Lake Storage Gen2; ClickHouse, InfluxDB, TDengine and Splunk; SQL Server, PostgreSQL, MySQL, Oracle and Firebird; Apache Kafka, RabbitMQ, MQTT, Sparkplug B and Redis; and any REST endpoint. A platform that reads from a data lake or a broker takes the data from there.
- What happens when the internet link goes down?
- The Edge Gateway keeps reading the machines and keeps what it cannot deliver: 48 hours by default, up to 30 days if you set it. When the target is reachable again, the queue is sent in order. The target’s status, last success, last failure and queue stay on screen the whole time.
- How do we know nothing is missing?
- Two screens answer it. The data completeness screen compares, for every source and hour, the minutes Proxus received with the minutes expected and lists every gap with its start, end and minutes missing. The target list shows, per target, the last success, the last error and what is still queued.
- Do we have to send everything to the cloud?
- No. Each device sends only to the targets you choose, and Proxus keeps its own history on your servers. Sending to a cloud is optional.
- How is it priced?
- Pricing starts from $5,500 a year (Starter, one Edge Gateway). The price follows the number of Edge Gateways and the data capacity, not machines, tags or targets; users and dashboards are unlimited.
Next step
Let’s pick the first feed.
Tell us where the plant data should land and what it is for. A Proxus engineer gets back to you and scopes the pilot with you.
Tell us about your plant
A Proxus engineer replies within one working day.
Rather look around first? Try the live demo