Downtime tracking
Know why every line stopped, without a logbook.
Which machine stops most, for what reason, and how many hours did it cost this week?
Proxus reads your machines’ states and fault codes from the PLCs and records every stop: when it started, how long it lasted and the cause the equipment reported. Downtime by cause and by machine is on screen while the shift is still running, not in a spreadsheet the next morning.
The live demo opens in your browser with your name, company and work email. Nothing to install.
Pricing from $5,500 a year- 60+ machine protocols
- The PLC program stays as it is
- Unlimited users and dashboards
Running every day at these plants.See deployments


On the screen
Three questions about downtime, answered from the machine data.

What costs us the most downtime?
Downtime minutes by cause for all lines, and a table of every equipment and cause with its number of stops and minutes lost. The cause worth fixing first is at the top of the list.
- Minutes lost per cause, largest first
- Stops and minutes per equipment and cause
- All lines or a single line

Which machine loses the most time?
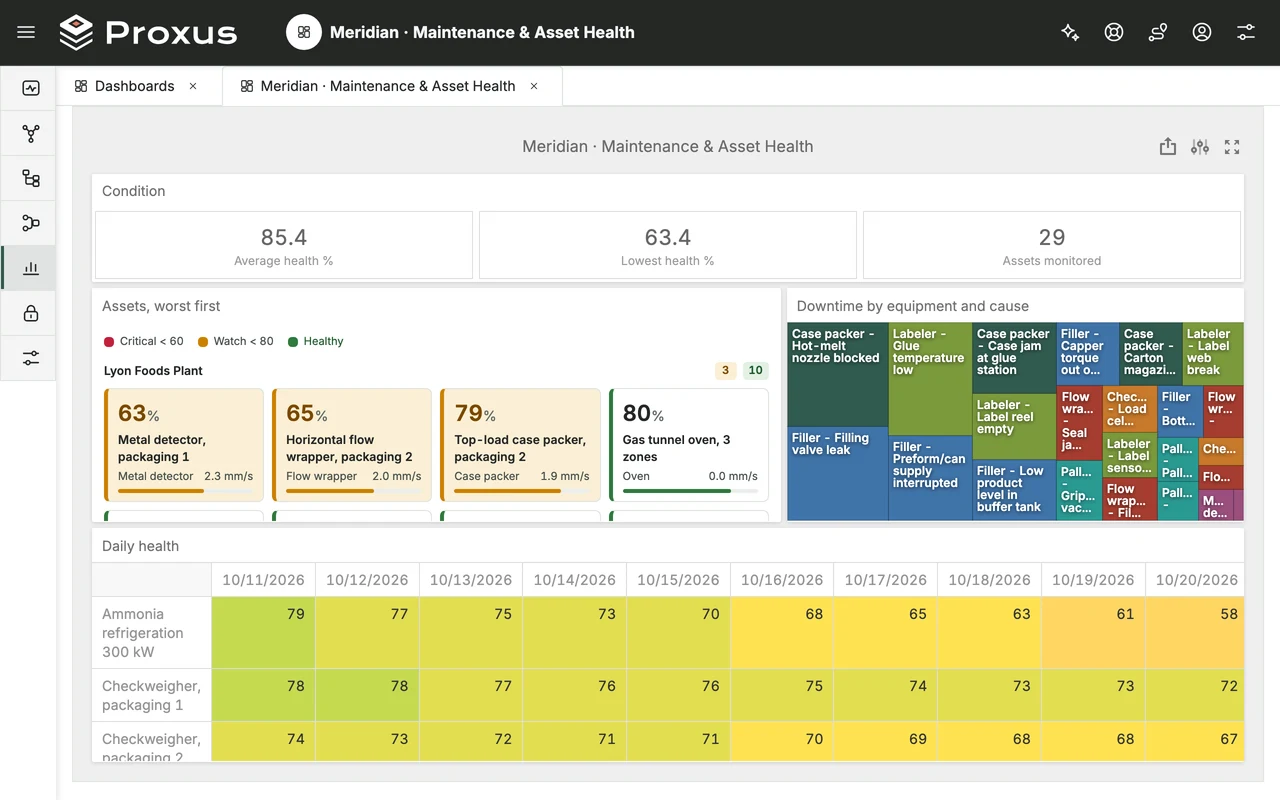
One tile per machine and cause, sized by the downtime it caused. A filler valve leak or a case packer jam that keeps coming back stands out at a glance, next to the health of each machine.
- Downtime by machine and cause on one map
- The largest losses as the largest tiles
- Machine health on the same screen

When did the line stop, and for how long?
Each line’s running and stopped time on one timeline, with faults, changeovers, waiting and cleaning in their own colours. The short stops that never reach a logbook are there too.
- Every stop on the timeline, with its length
- Faults, changeovers and waiting apart
- From a week down to a single shift
Try these screens yourself, in your browser.
The same stops on the production office laptop, the maintenance tablet and the supervisor’s phone.
Open the live demoThe live demo opens in your browser with your name, company and work email. Nothing to install.
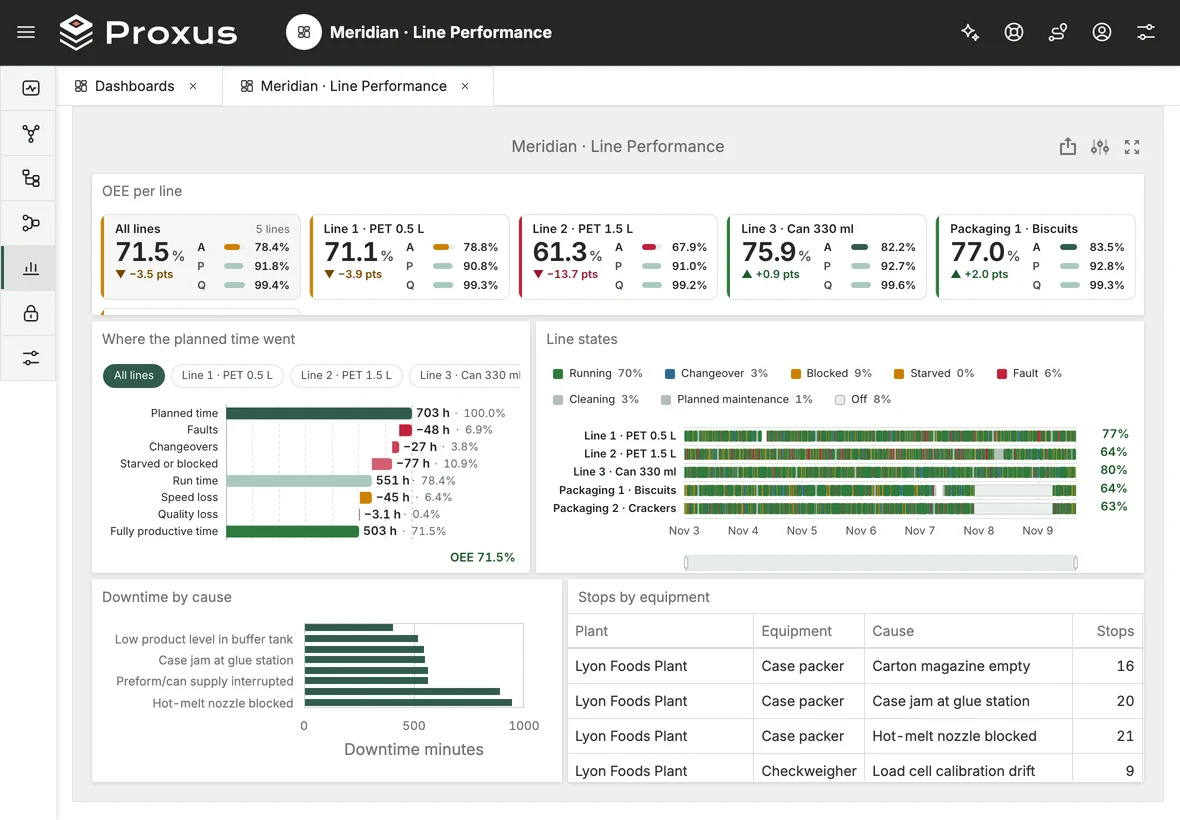
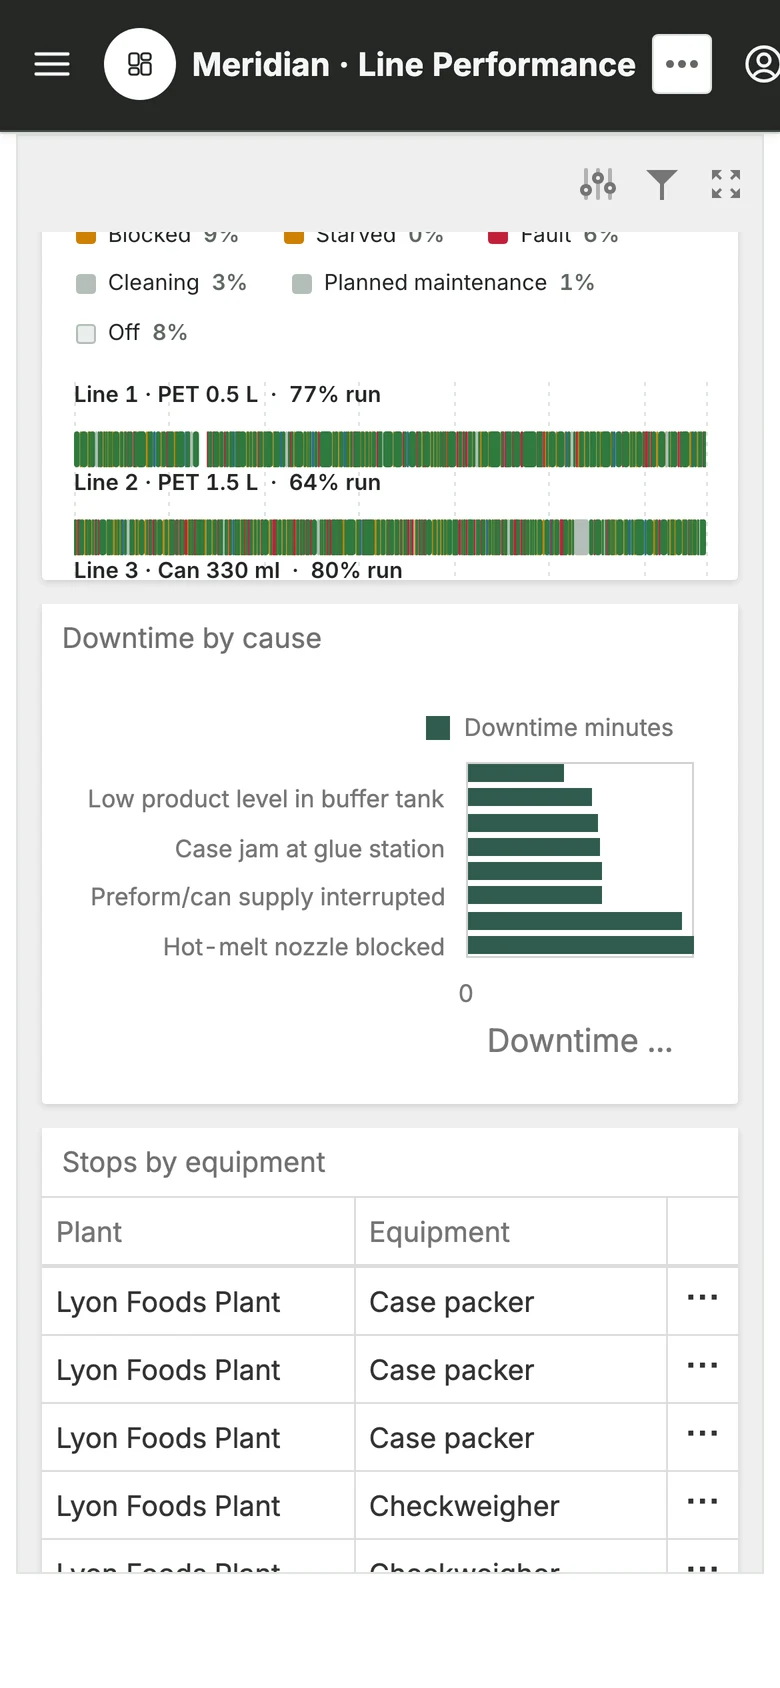
Real Proxus screens; the production data shown is simulated.
In your plant
From the machines you have, without changing their programs.
-
The PLC program stays as it is
Each controller is read over its own protocol. The machine’s states, fault codes and counters are enough; not a line of the program changes.
-
60+ machine protocols
Siemens S7, Modbus, OPC UA and many more industrial protocols. For older machines without a usable state signal, we look at sensor or I/O module options with you.
-
Short stops are counted too
A stop is recorded from the machine signal, so the two-minute jams that nobody writes down add up on screen.
-
The downtime report comes to you
A scheduled report of the stops and their causes, delivered by email at the time you set.
-
Lines and plants side by side
Every line is measured the same way, so their downtime can be compared on one screen.
-
Your data stays with you
Runs on your own servers. Sending data to a cloud is optional.
How you start
Start with the line that stops most.
Pick the line whose stops are argued about most. We list its machines and the states and fault codes they report with you; once that line is live, the same setup moves to the rest of the plant.
- We list the machines, states and fault codes together
- The first line’s stops and causes are on screen
- The same setup moves to the other lines and plants
Starter · one Edge Gateway
From $5,500 / year
- Unlimited users and dashboards
- No per-machine fees
- Runs on your own servers
An annual licence. The price follows the number of Edge Gateways and the data capacity you choose, not machines. Excluding taxes.
Request a pilot call Pricing in detail- Where does the stop reason come from?
- When a stop starts and how long it lasts comes from the machine. The reason is read from the states and fault codes the equipment reports; how detailed it gets depends on your machines, and we check it with you before the pilot.
- Do we have to change the PLC program?
- No. Proxus reads each controller over its own protocol and leaves the program as it is.
- Our machines are old. Will it still work?
- Usually, yes. A running or stopped signal is enough to record stops and their length. Where an older machine does not expose one, we look at a sensor or an I/O module with you.
- How is this different from your OEE page?
- It is the same product. This page is about the stops themselves: their causes, lengths and machines. If you also want availability, performance and quality as one OEE figure, see OEE software.
- How is it priced?
- Pricing starts from $5,500 a year (Starter, one Edge Gateway). The price follows the number of Edge Gateways and the data capacity, not machines or tags; users and dashboards are unlimited.
Next step
Let’s pick the line to start with.
Tell us which stops cost you most. A Proxus engineer gets back to you and scopes the pilot with you.
Tell us about your plant
A Proxus engineer replies within one working day.
Rather look around first? Try the live demo