
Feb 25, 2026 · 12 min read
Methodology notes
Getting Started with IIoT: From SCADA to Real-Time Event Architecture
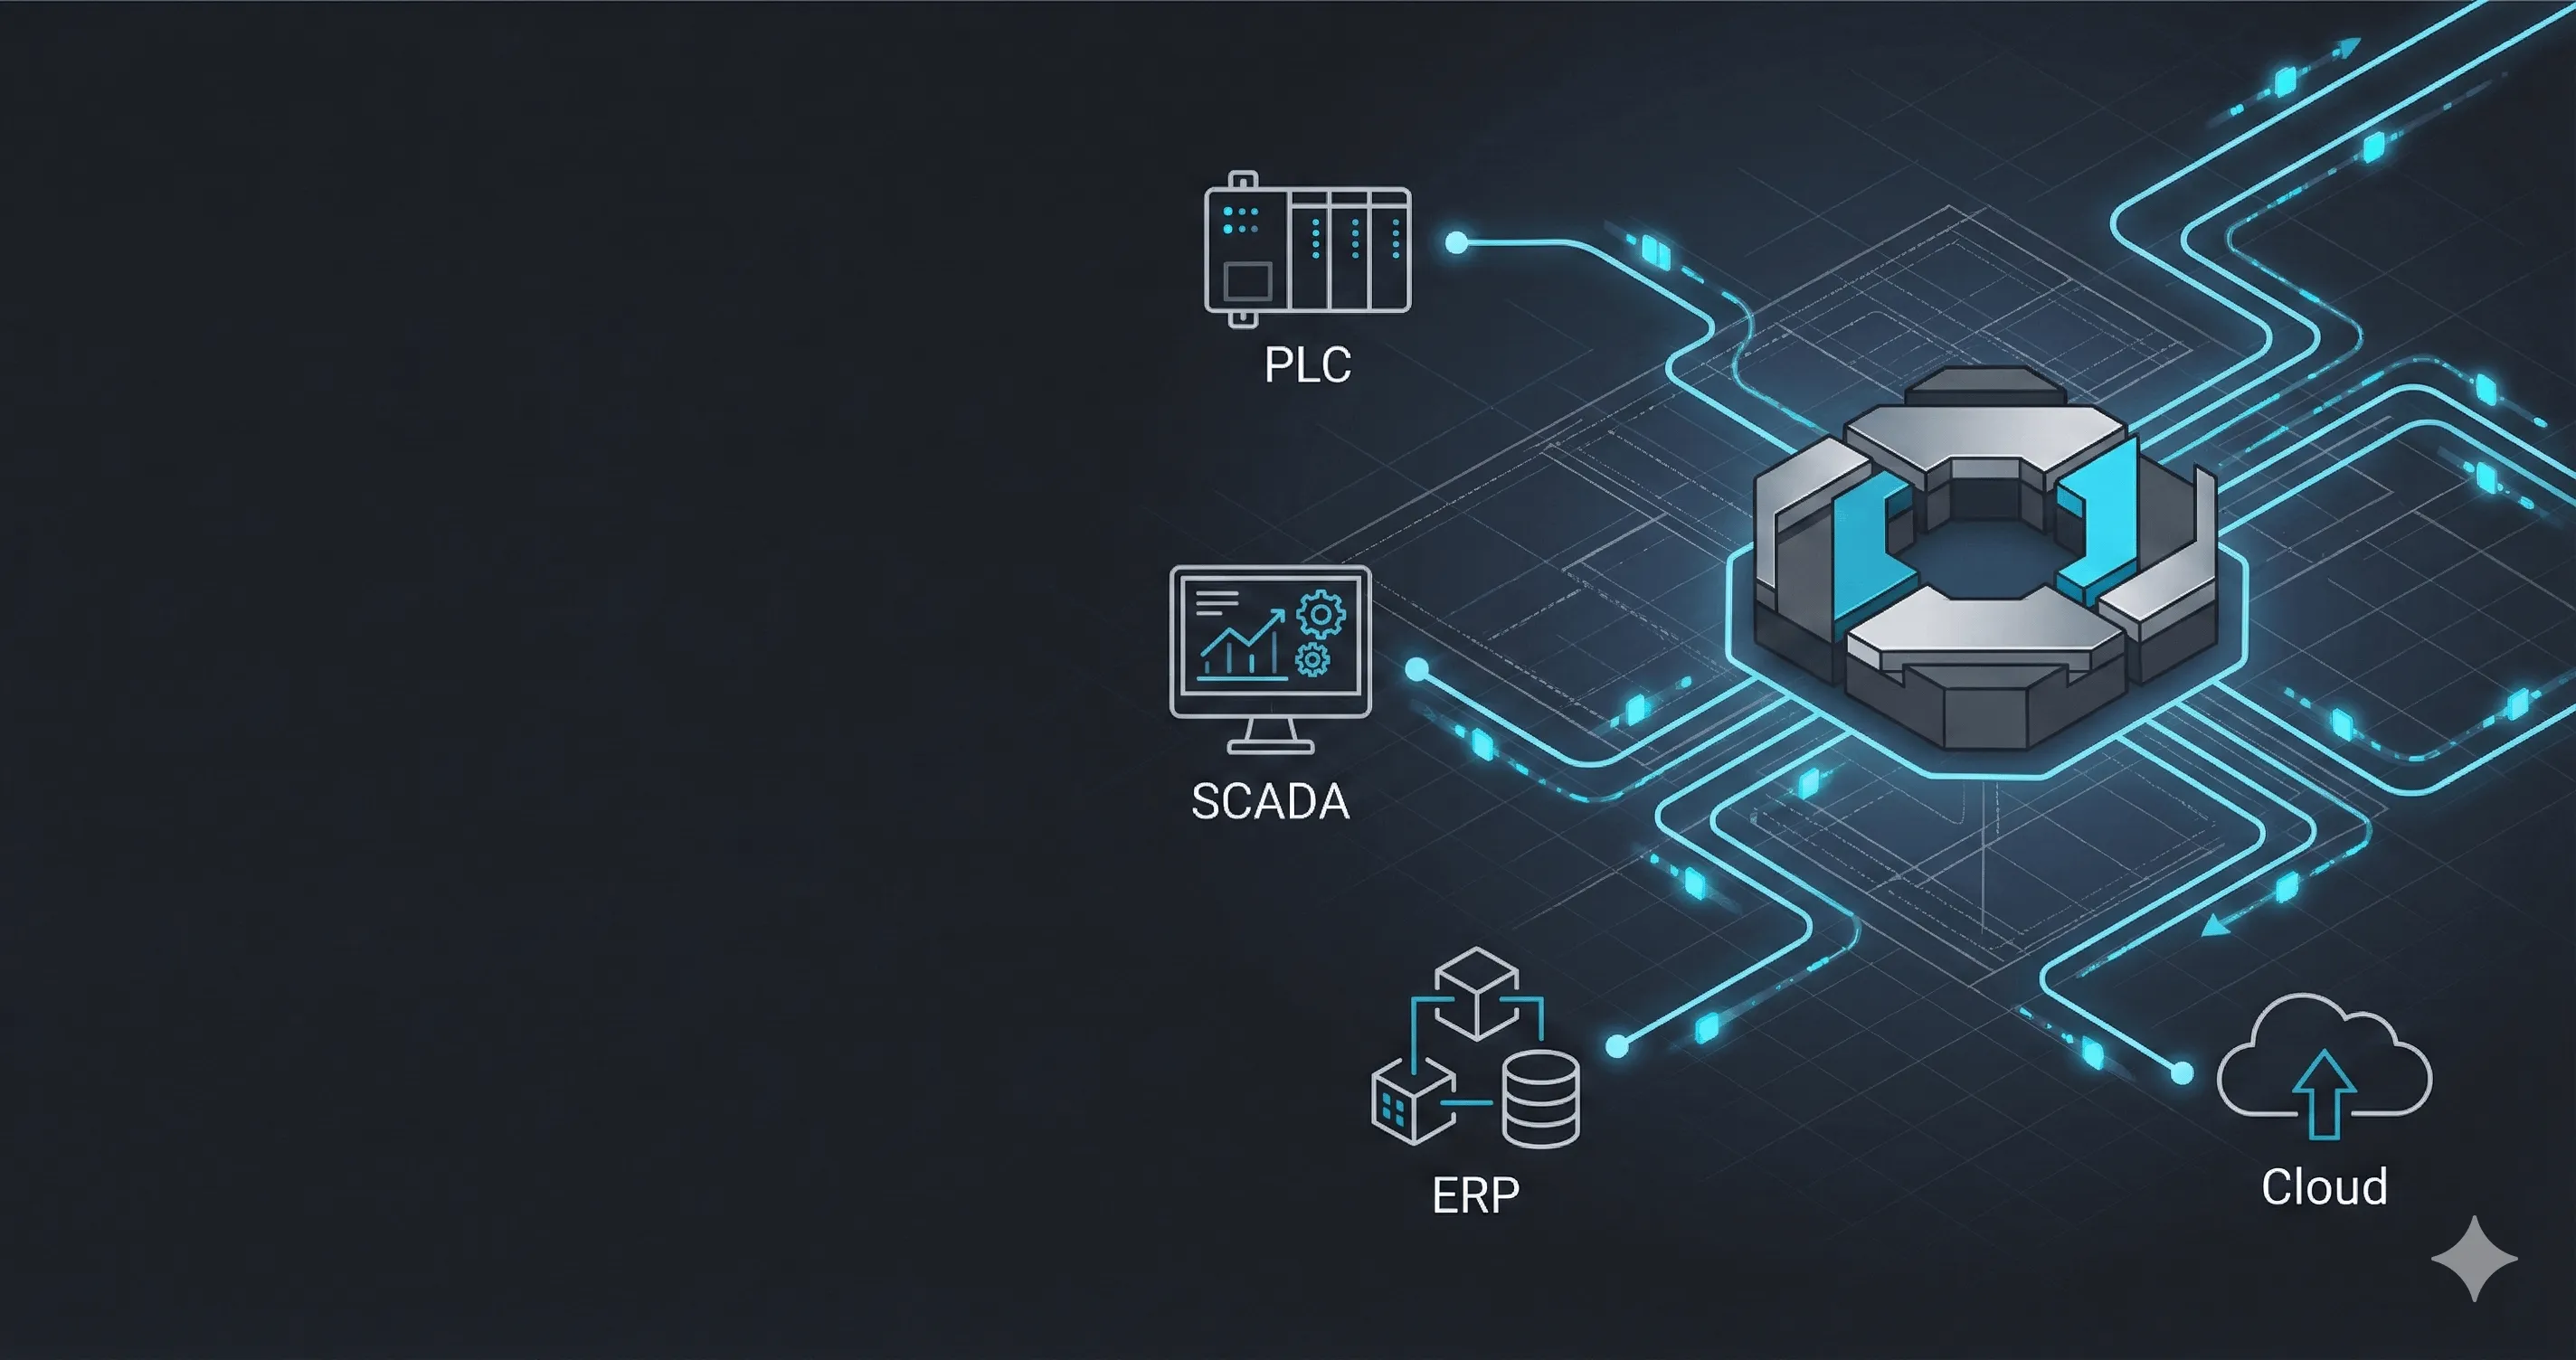
A practical introduction to IIoT architecture, edge data collection, operational context, and a phased path toward an industrial data platform.
- Evidence level: Medium (field observations + public standards; not a universal benchmark).
- Measurement scope: Performance and economic outcomes vary by hardware, topology, workload shape, sampling profile, and process constraints.
- Primary references: IEC 62443-2-1, ISA-95 / IEC 62264, NIST SP 800-82r3.
- Implementation docs: Edge Architecture and Unified Namespace.
If you're building or modernizing an industrial operation and you've started hearing terms like "IIoT," "Edge Computing," "Unified Namespace," and "Predictive Maintenance" in boardroom meetings, you're standing at a critical crossroads. Your factory's digital future depends on understanding which architectural patterns actually work in the real world-not in a PowerPoint slide.
In this guide, I'll walk you through the essential concepts of Industrial IoT from first principles, explain why legacy SCADA systems are becoming obsolete, and show you the modern architectural patterns that the most competitive manufacturers are deploying today.
What Is IIoT? And Why Does It Matter?
Industrial IoT is simply the practice of connecting machines, sensors, and control systems to a data pipeline that enables real-time visibility, automated decision-making, and continuous improvement.
But that sounds abstract. Let me be concrete: Your factory probably loses millions of dollars every year to downtime events that could have been prevented with 48 hours of notice.
Across years of building industrial software, I've seen manufacturers with:
- Assembly lines that halt unexpectedly, costing tens of thousands of dollars per hour in high-volume manufacturing
- Quality defects discovered weeks later during customer inspection (after shipping)
- Maintenance teams working in pure "firefighting mode," reactively replacing equipment only after catastrophic failure
- Operators managing 50 production lines with no real-time view of what's actually running
This is not a technology problem. This is an architecture problem.
IIoT solves it by moving from Reactive Maintenance ("Fix it when it breaks") to Predictive Maintenance ("Detect the failure signal weeks in advance"). The data exists. Your machines are screaming warnings in vibration, temperature, and power consumption signals. You just need the right architecture to listen.
Where a SCADA-centric data architecture becomes constrained
For the past 30 years, the standard industrial data architecture looked like this:
PLC → SCADA Server → HMI Screen → Operator's MonitorA Programmable Logic Controller (PLC) on the factory floor runs embedded logic, flips digital outputs to motors, and reads sensor inputs. A SCADA (Supervisory Control and Data Acquisition) system pulls data from the PLC and displays it on an operator's screen.
This works fine for real-time control. But it catastrophically fails when you need:
- Historical trending (Why did that motor fail? Let me check 6 months of vibration data)
- Cross-asset correlation (Which three machines frequently fail together?)
- Predictive analytics (When will this bearing fail?)
- Multi-site visibility (What's running at my facility in Germany vs. Mexico?)
- Enterprise integration (Link production data to my ERP system)
Why? Because traditional SCADA systems were built with a centralized, pull-based architecture:
- The SCADA server continuously polls each PLC
- Each poll costs network bandwidth
- Historical data is rarely retained (or stored expensively)
- Adding a second consumer (a cloud dashboard, an AI algorithm, a mobile app) means building a new custom connector to the PLC
As source and consumer count grows, a point-to-point architecture can accumulate:
- Network congestion
- Cloud ingress and retention costs that depend on volume and provider pricing
- Network-dependent alert latency
- Brittle point-to-point integrations
| Capability | Traditional SCADA | Modern IIoT Architecture |
|---|---|---|
| Data Flow | Pull-based (SCADA polls PLCs) | Event-driven (MQTT publish-subscribe) |
| Historical Data | Often application-specific | Policy-based operational retention |
| Enterprise Integration | Point-to-point custom code | Governed shared namespace and APIs |
| Upstream Data Volume | Raw flow must be measured | Filtering impact must be validated |
| Latency (alerts) | Depends on network and central path | Local path avoids a central round trip |
| Scaling Cost | Repeated consumer integrations | Shared contracts reduce duplicated work |
The Modern IIoT Architecture: Three Core Layers
Professional manufacturers today deploy a three-layer architecture:
Legacy PLC
Siemens S7, Modbus
Industrial Sensors
1,000+ devices
Edge Gateway
Local Intelligence
MQTT Broker
Unified Namespace
Cloud AI / Analytics
Predictive Models
ERP Integration
SAP / Oracle
Layer 1: The Factory Floor (PLC + Sensors)
Your existing programmable logic controllers and sensor hardware stay in place. No rip-and-replace. This layer handles deterministic, safety-critical control.
Layer 2: Edge Computing (Local Intelligence)
A Proxus Edge Gateway (or similar industrial edge device) sits on the factory floor, physically close to the machines. Instead of blindly forwarding every sensor reading to the cloud, the Edge Gateway acts as an intelligent bouncer:
- Filters redundant data (Why send the same temperature reading 100 times per minute?)
- Runs local logic (If motor temperature exceeds 85°C, immediately trigger a maintenance alert-don't wait for the cloud)
- Buffers during outages (Network goes down? Store data locally and replay it later)
- Aggregates and normalizes (Convert raw PLC registers into clean, standard JSON messages)
The Edge Gateway publishes meaningful events to a central MQTT broker using a standardized message format. This is your Unified Namespace.
Layer 3: Cloud / Central Server (Analytics + Enterprise Integration)
Cloud or on-premises consumers subscribe to approved MQTT topics and receive the context defined by the operational model. A shared namespace can reduce duplicated connectors, but it does not eliminate consumer-specific contracts, data ownership, or reconciliation.
Core Concepts You Need to Know
Edge Computing: Processing Data Where It Lives
Instead of forwarding every raw sample to an upstream system, decide at the edge which raw, event, aggregate, and contextual data each consumer actually needs.
Practical impact: Filtering can reduce upstream volume, but the result depends on signal behaviour and policy. Validate compression, event detection, information loss, latency, and replay behaviour with representative production data.
Learn more: Smart Filtering in Edge Computing
Unified Namespace (UNS): A Shared Operational Model
Instead of maintaining separate databases for SCADA, MES, ERP, and analytics systems, use a publish-subscribe architecture where all factory data flows through one MQTT broker. Any application (dashboard, AI model, mobile app, SAP connector) subscribes to the topics it needs.
Result: Eliminate data silos, reduce integration complexity, and enable real-time cross-system correlation.
Learn more: The Architect's Guide to Unified Namespace
Predictive Maintenance: From Reactive to Preventive
Most manufacturers practice Reactive Maintenance: Replace the component when it fails (after the downtime has cost hundreds of thousands of dollars on a critical production line). Predictive Maintenance means detecting the failure signal weeks in advance (e.g., vibration anomaly at 2% deviation), scheduling the replacement during planned maintenance windows, and potentially avoiding the bulk of that unplanned stoppage cost.
This requires:
- High-frequency sensor data (vibration, current, temperature)
- Local anomaly detection (at the edge, in milliseconds)
- Historical trending (storing weeks/months of baseline data)
- Integration with your maintenance system (SAP, Maximo)
Success measure: Establish a baseline for failure frequency, warning lead time, false positives, maintenance response, and avoided impact before claiming improvement.
Learn more: Cost of Machine Downtime and Prevention
Store and Forward: Network Resilience
Factory internet links can and do drop in real deployments. A robust IIoT architecture buffers data locally during outages and replays when connectivity returns, which can dramatically reduce data-loss and manual-recovery risk when retention, disk health, and replay controls are correctly configured.
Learn more: Store and Forward in IIoT
Choosing the Right Technology Stack
Modern IIoT deployments typically use:
Messaging & Protocols
- Protocol: MQTT with Sparkplug B (lightweight, standardized, scalable) for cloud telemetry; OPC UA for local machine-to-machine communication
- Local: Modbus TCP/RTU, S7, PROFINET for legacy equipment connectivity
- Cloud Transport: MQTT, AMQP, or gRPC with TLS encryption
Data Infrastructure
- Messaging Broker: A durable, persisted broker for the Unified Namespace
- Time-Series Storage: TimescaleDB or InfluxDB (optimized for sensor readings)
- Retention Policy: 30 days raw data at full resolution, 5+ years aggregated (15-min averages)
Processing & Rules
- Edge Rules: Local (at the edge) for millisecond-latency decisions (threshold checks, state machines, anomaly detection)
- Cloud Rules: Complex, cross-asset correlations requiring historical data
- Execution: Choose an execution model from measured rule volume, state, timing, failure isolation, and deployment requirements
Visualization & Integration
- Dashboarding: Low-code tools (Grafana, Quicksight, Power BI)
- Enterprise Integration: REST APIs or webhooks to SAP, Salesforce, Microsoft Teams, Slack
- Mobile Access: Real-time alerts, readonly dashboards, maintenance ticket creation
But technology is secondary. The pattern matters more than the specific tool. Whether you choose Proxus, AWS IoT Greengrass, Azure IoT Edge, or a custom solution, the fundamental architecture should be:
- Decoupled (Machines don't know about cloud systems)
- Resilient (Local operation continues during cloud outages)
- Filterable (Only meaningful data reaches the cloud)
- Extensible (Adding a new consumer doesn't require touching the PLC or edge gateway)
The Path Forward: A Three-Phase Implementation
Phase 1: Foundation and pilot
Deploy an Edge Gateway on your bottleneck production line. Configure it to ingest from your existing PLC and normalize the data into a standard message format (JSON). Publish to a local MQTT broker.
Outcome: Real-time visibility of your critical line with zero changes to your PLC logic.
Start with one production line. Choose your bottleneck-the line with highest uptime criticality or quality impact.
Phase 2: Context and workflows
Build local rules on the edge (temperature thresholds, anomaly detection, equipment state machines). Integrate with your maintenance system (SAP, Maximo) via REST API or webhooks. Store 30 days of historical data locally.
Outcome: A measured alert workflow with known signal quality, responsible owners, and maintenance-system handoff.
Do not scale until the pilot demonstrates useful lead time, manageable false positives, reliable data capture, and an operating response to the alert.
Phase 3: Governed multi-site scale
Deploy edge gateways to 5-10 additional production lines. Centralize analytics in the cloud. Build dashboards linking production metrics to financial impact (OEE, cost of goods sold, downtime cost).
Outcome: Governed multi-site visibility and repeatable deployment patterns, with results reported against each site's baseline.
When IIoT Implementation May Not Be Suitable
- Very small facilities (1-2 production lines) may find simpler SCADA upgrades sufficient initially
- Highly legacy environments with strict IT constraints may require phased adoption (start with one production line)
- Non-critical, low-frequency data (maintenance logs, shift reports) doesn't justify edge complexity-cloud-only may be adequate
- Safety-critical control (emergency stops, motor interlocks) should remain in the PLC layer, not in cloud rules
Results vary with facility complexity, data volume, and existing infrastructure maturity.
Frequently Asked Questions
How long does an IIoT implementation typically take?
There is no responsible universal duration. Estimate the work from source inventory, protocol and tag scope, network and security approvals, operational model, acceptance testing, change windows, and rollout governance.
What's the typical ROI?
Build ROI from the site's own baseline: downtime contribution loss, emergency labour, scrap, energy, data-engineering effort, licensing, hardware, implementation, and ongoing ownership. Report measured changes with the observation window and attribution limits.
Do I need to replace my existing PLC?
No. IIoT platforms integrate with existing equipment via standard protocols (Modbus, S7, OPC UA, SNMP). Your 20-year-old Siemens PLC is perfectly usable.
Can an IIoT system operate offline?
Local collection and approved rules can continue without a cloud connection when their dependencies remain available. Replay outcome depends on local capacity, outage duration, connector acknowledgement, target health, ordering policy, and tested recovery procedures.
How much data will I need to store?
Size storage from measured encoded payload size, tag count, sample/event rate, compression, indexes, replication, retention tiers, headroom, and replay requirements. Test the real connector and query workload rather than extrapolating from tag count alone.
Next Steps
Now that you understand the fundamentals, explore these deeper dives:
Edge Computing Patterns
Five proven designs for high-performance edge systems that actually work in brutal factory conditions.
MQTT vs. OPC UA
Choose the right protocol for your brownfield factory. Real trade-offs, not hype.
Unified Namespace Guide
Break out of SCADA silos. Build a real-time event architecture that scales.
Cost of Downtime
Define downtime cost, warning signals, and a measurable maintenance workflow.
Rule Engine Design
Build decision logic with explicit state, load, rollout, and failure boundaries.
OEE Calculation
Stop trusting Excel. Real-time equipment effectiveness with millisecond resolution.
To evaluate how this topic fits into a customer-controlled operational data architecture, review the Proxus Industrial Data Platform and the implementation documentation linked above.
References
- IEC 62443 - Security model and segmentation guidance for industrial automation environments.
- ISA-95 / IEC 62264 - Enterprise-control system integration hierarchy and data context boundaries.
- NIST SP 800-82r3 - Industrial control systems security guidance.
- Unified Namespace Core Concept - Proxus docs for namespace modeling scope.