Reference · for Engineers, Operators
Asset Health Matrix
A dashboard item with one tile per asset, grouped by plant or area and ordered worst first, coloured by a health index against two thresholds.
The Asset Health Matrix shows one tile per asset with its health index, so a maintenance planner sees at a glance which assets to look at first. Use it where a list of machines would hide the few that need attention: a maintenance dashboard, a plant overview, a shift handover screen.
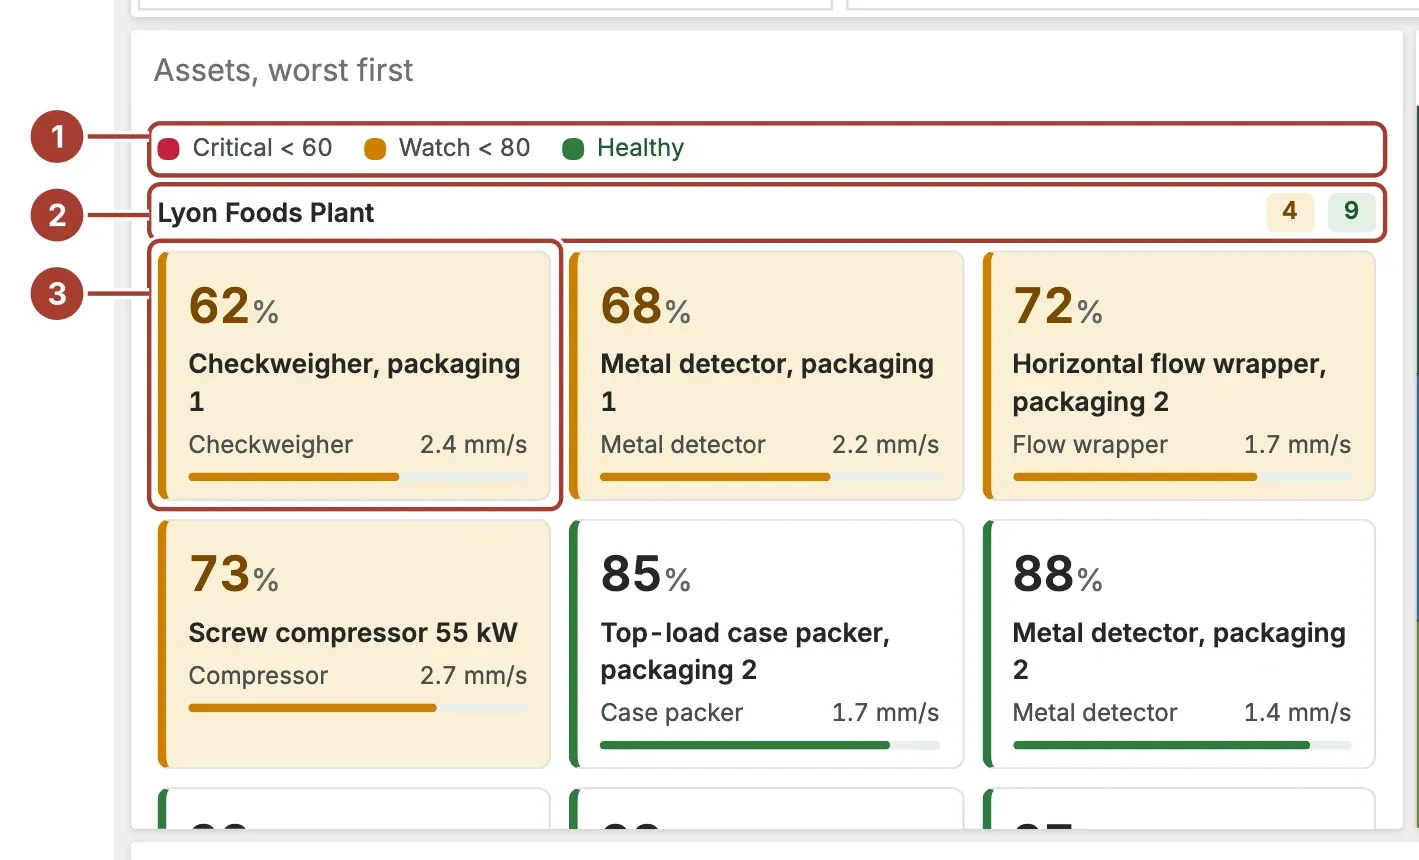
- Legend. The colours and the thresholds they stand for: Critical below the critical threshold, Watch below the warning threshold, Healthy above both.
- Group. One section per value of the Group field, such as a plant or an area. The figures on the right count the tiles in it by colour (critical, watch, healthy).
- Tile. One asset: its health in percent, its name, its kind, the detail figure if you gave one, and a bar filled to its health. Within a group, tiles are ordered from the lowest health.
Select a tile to filter the other items of the dashboard by that asset.
Data fields
| Field | Kind |
|---|---|
| Group | Dimension |
| Asset | Dimension |
| Kind | Dimension |
| Health | Measure |
| Detail | Measure |
Asset and Health are required; without them the item asks for them instead of drawing tiles. Health is read as a percentage from 0 to 100. Leave Group empty for one section with every asset. Detail is a second figure for each tile, such as vibration or temperature, shown as the field formats it.
Settings
| Setting | Values | Default |
|---|---|---|
| Warning below | A number from 0 to 100 | 80 |
| Critical below | A number from 0 to 100 | 60 |
| Detail label | Text | — |
- Warning below and Critical below set the colours: a tile is critical below the critical threshold and needs watching below the warning threshold. Keep the critical threshold the lower of the two.
- Detail label is written after the detail figure, for its unit (for example
mm/s).
Where to see it
The Meridian demo plant uses it on Meridian · Maintenance & Asset Health, with one group per plant and vibration as the detail figure.
Related
Was this page helpful?
Evaluating Proxus? See it on your own machines in a 30-minute technical session.