Reference · for Engineers, Operators
Sankey
A dashboard item that draws flows between nodes as bands whose width follows the amount, such as energy from its sources to plants and areas.
The Sankey draws how an amount flows from one place to the next. Each band runs from a source to a target and is as wide as the amount it carries. Use it to show where energy, water, material or product goes and where it is lost: an energy dashboard, a material balance, a yield review.
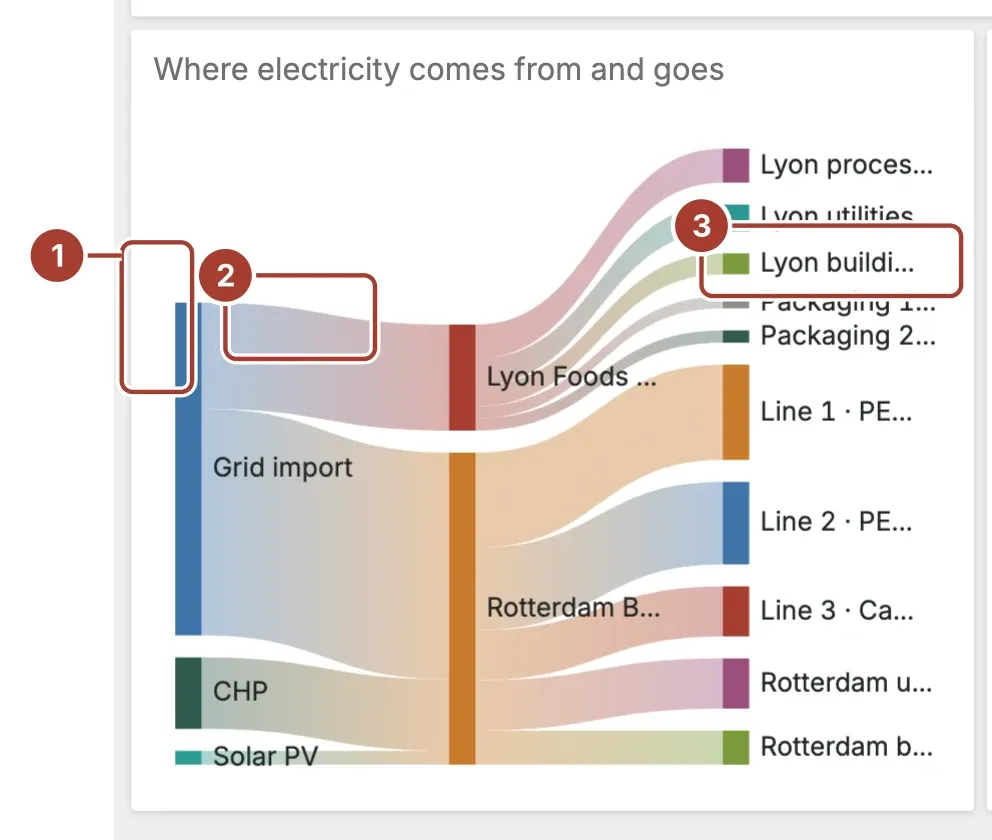
- Node. One value of Source or Target, such as a supply or a plant. Its height is the total that flows through it, and each node has its own colour.
- Link. One flow from a source to a target, as wide as its Value. It shades from the source's colour to the target's.
- Label. The node's name, to the right of the node. Long names are shortened to fit.
Hover a node to highlight its links, or a link to see its source, target and amount. Select a link to filter the other items of the dashboard by it, or to drill down if the item has a drill-down set up.
Data fields
| Field | Kind |
|---|---|
| Source | Dimension |
| Target | Dimension |
| Value | Measure |
All three fields are required; without them the item stays empty. Each row is one link. A node that is the target of one row and the source of another becomes a middle column, so a single query can describe several steps. Value must be a number; rows with an empty or non-numeric value are left out. Amounts in the tooltip are rounded to whole numbers.
Settings
| Setting | Values | Default |
|---|---|---|
| Node width | A number from 4 to 40 | 12 |
| Node gap | A number from 0 to 40 | 10 |
| Layout | None, Circular | None |
| Show Labels | No, Yes | Yes |
| Link opacity | A number from 0.1 to 1 | 0.4 |
- Node width is the width of each node in pixels.
- Node gap is the space between nodes in the same column, in pixels.
- Link opacity sets how solid the links are, from 0.1 to 1. Lower values let crossing links show through.
Where to see it
The Meridian demo plant uses it on Meridian · Energy & Sustainability, in the item "Where electricity comes from and goes". It shows the electricity over the dashboard's period in kWh: grid import, solar PV and CHP into each plant, and each plant on to its sub-metered areas and the rest of its load (building and HVAC).
Related
Was this page helpful?
Evaluating Proxus? See it on your own machines in a 30-minute technical session.