Reference · for Engineers, Operators
Heatmap
A dashboard item that draws a grid of cells, one per pair of values on two axes, coloured by a measure on a colour scale.
The Heatmap puts one value in each cell of a grid and colours it, so patterns across two dimensions stand out: the busy hours of each machine, the weak shifts of each line, the hot zones of each oven. Use it where a table of numbers is too dense to read and a line chart would need one line per row.
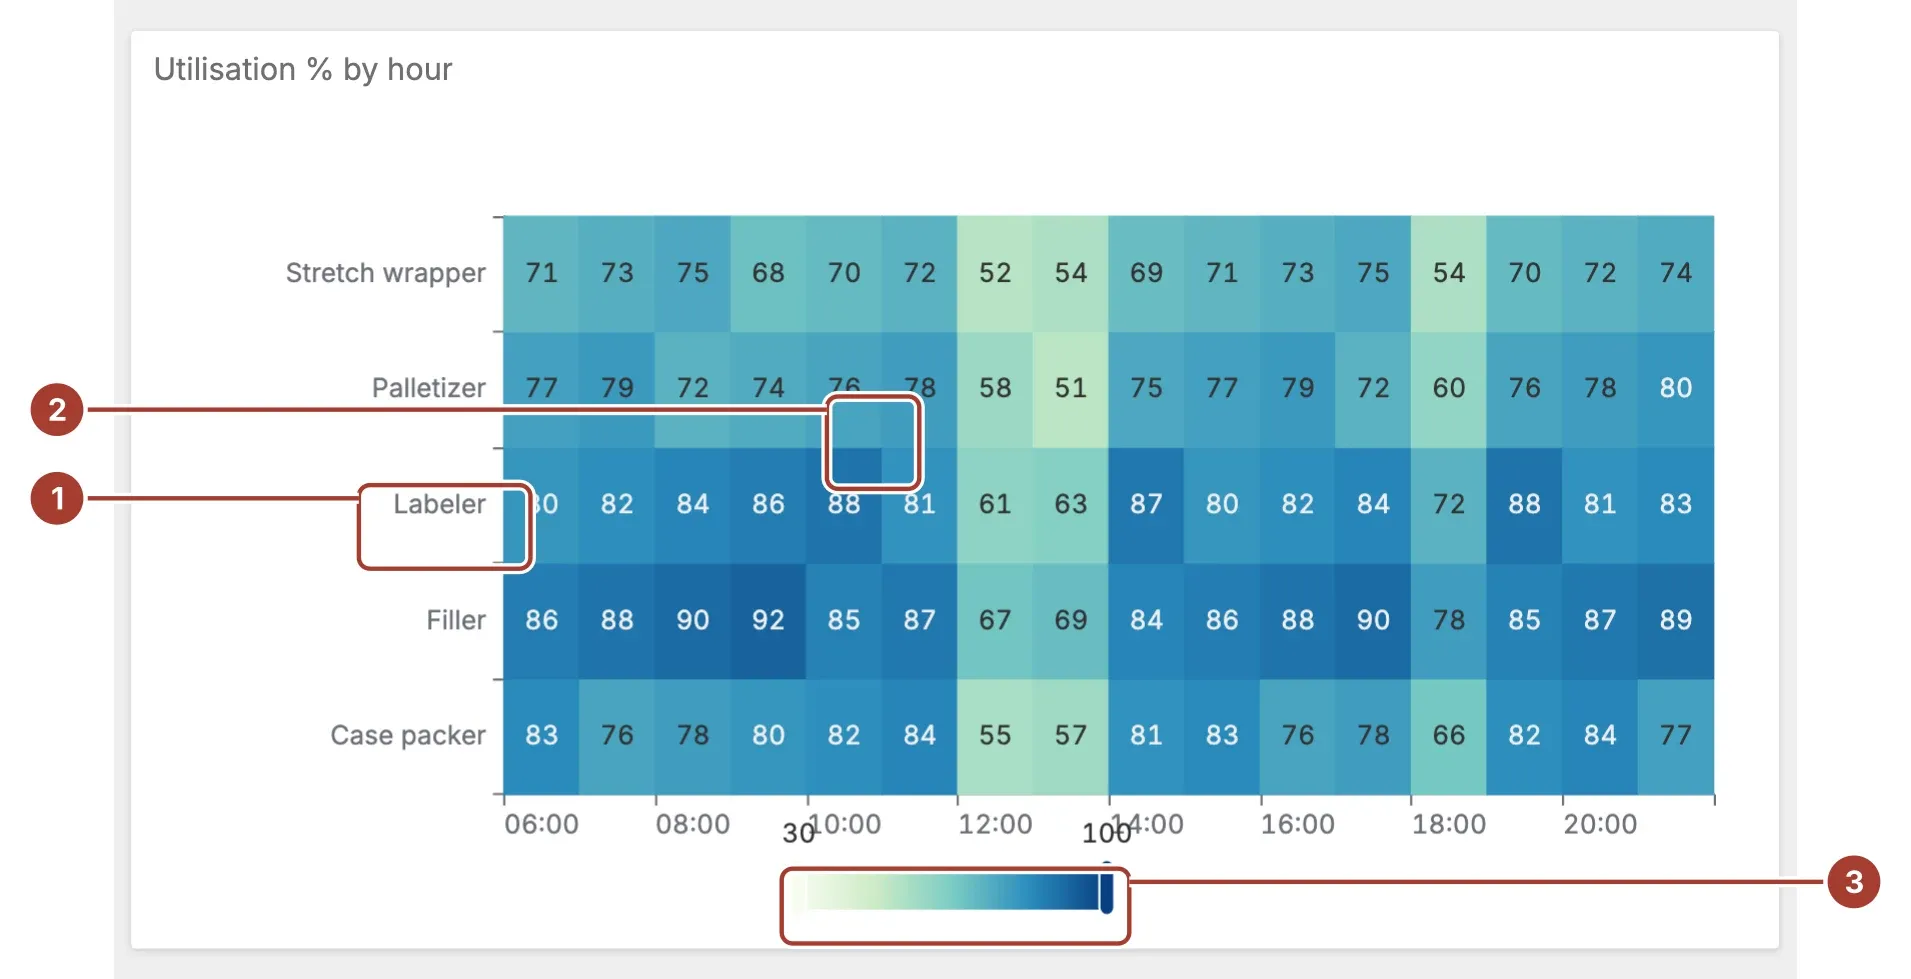
- Axes. The values of X Axis along the bottom and of Y Axis down the side, such as hours and machines. They appear in the order the data gives them.
- Cell. One pair of axis values, coloured by its Value. Hover a cell to see the value.
- Colour scale. The colours from Min value to Max value. Drag its handles to show only the cells within a narrower range.
Select a cell to filter the other items of the dashboard by it, or to drill down if the item has a drill-down set up. The selected cell gets a dark border.
Data fields
| Field | Kind |
|---|---|
| X Axis | Dimension |
| Y Axis | Dimension |
| Value | Measure |
All three fields are required; without them the item stays empty. X Axis and Y Axis are read as the text the field shows, so a date field grouped by hour gives one column per hour. Value must be a number; rows without a value are left out. To put the axes in order, sort the dimensions in the binding.
Settings
| Setting | Values | Default |
|---|---|---|
| Min value | A number | 0 |
| Max value | A number | 100 |
| Show Labels | No, Yes | No |
| Palette | BlueRed, Viridis, GreenYellow, Magma, Turbo | BlueRed |
| Cell gap | A number from 0 to 10 | 1 |
| Tooltip decimals | A number from 0 to 6 | 2 |
| X label rotation | A number from -90 to 90 | 0 |
| Y label rotation | A number from -90 to 90 | 0 |
- Min value and Max value fix the ends of the colour scale. The defaults, 0 and 100, suit percentages. If you clear one, the item takes the lowest or highest value in the data.
- Palette picks the colours of the scale, from the first colour at the minimum to the last at the maximum.
- Show Labels writes the value in each cell.
- Cell gap is the width of the border between cells, in pixels.
- Tooltip decimals is the number of decimals shown when you hover a cell.
- X label rotation and Y label rotation turn the axis labels, in degrees, so long labels fit.
Related
Was this page helpful?
Evaluating Proxus? See it on your own machines in a 30-minute technical session.