Reference · for Engineers, Operators
Gantt Chart
A dashboard item that lists tasks with their start and finish dates and draws them as bars on a day scale, with child tasks under their parent.
The Gantt Chart shows a plan: a list of tasks on the left and a bar for each task on a day scale on the right. Child tasks sit under their parent, so a larger job reads as its steps. Use it for planned work with dates: a maintenance shutdown, a changeover plan, a project on the shop floor.
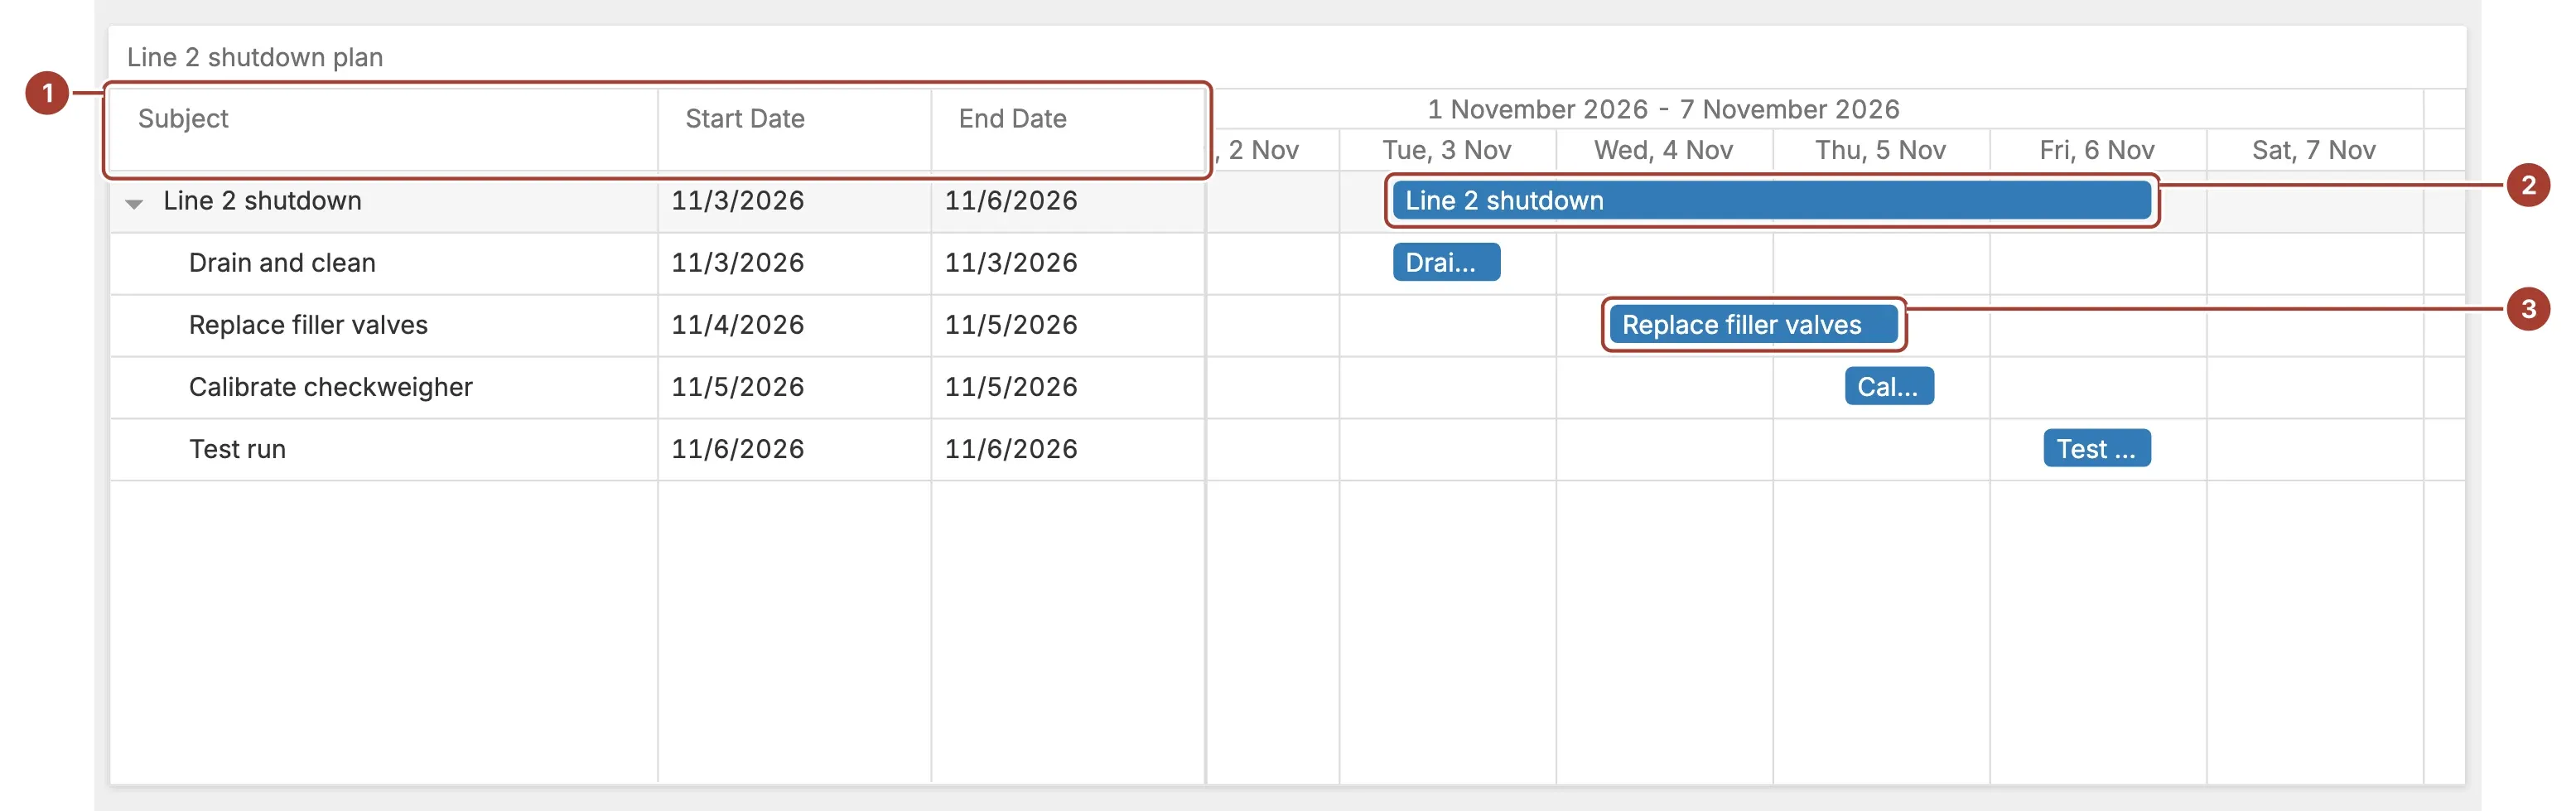
- Task list. One row per task with its subject, start date and end date. A parent task can be collapsed to hide its child tasks.
- Parent task. A task that other tasks name as their parent. Its bar spans the work under it.
- Task bar. One task, from its start date to its finish date, on a scale of days.
Select a task to filter the other items of the dashboard by that task.
Data fields
| Field | Kind |
|---|---|
| ID | Dimension |
| Parent ID | Dimension |
| Text | Dimension |
| Start Date | Dimension |
| Finish Date | Dimension |
Give every task a unique ID and its title in Text. Parent ID is the ID of the task it belongs under; top-level tasks take -1. Start Date and Finish Date must be dates: bind date-time fields and group them by an exact date, not by year or month alone. If either one is not a date, the item shows the warning "Gantt: 'Start Date' or 'Finish Date' is not a Date object." and draws no tasks.
Settings
This item has no settings of its own.
The task list is 500 pixels wide and the scale is in days.
Related
Was this page helpful?
Evaluating Proxus? See it on your own machines in a 30-minute technical session.