Reference · for Engineers, Operators
Pareto chart
A dashboard item that sorts categories largest first and draws their cumulative share, to find the few causes behind most losses.
The Pareto chart sorts categories from the largest value to the smallest and adds up their share as it goes. It shows which few causes account for most of a problem, so a team knows where to start. Use it for downtime by cause, rejects by defect, alarms by source.
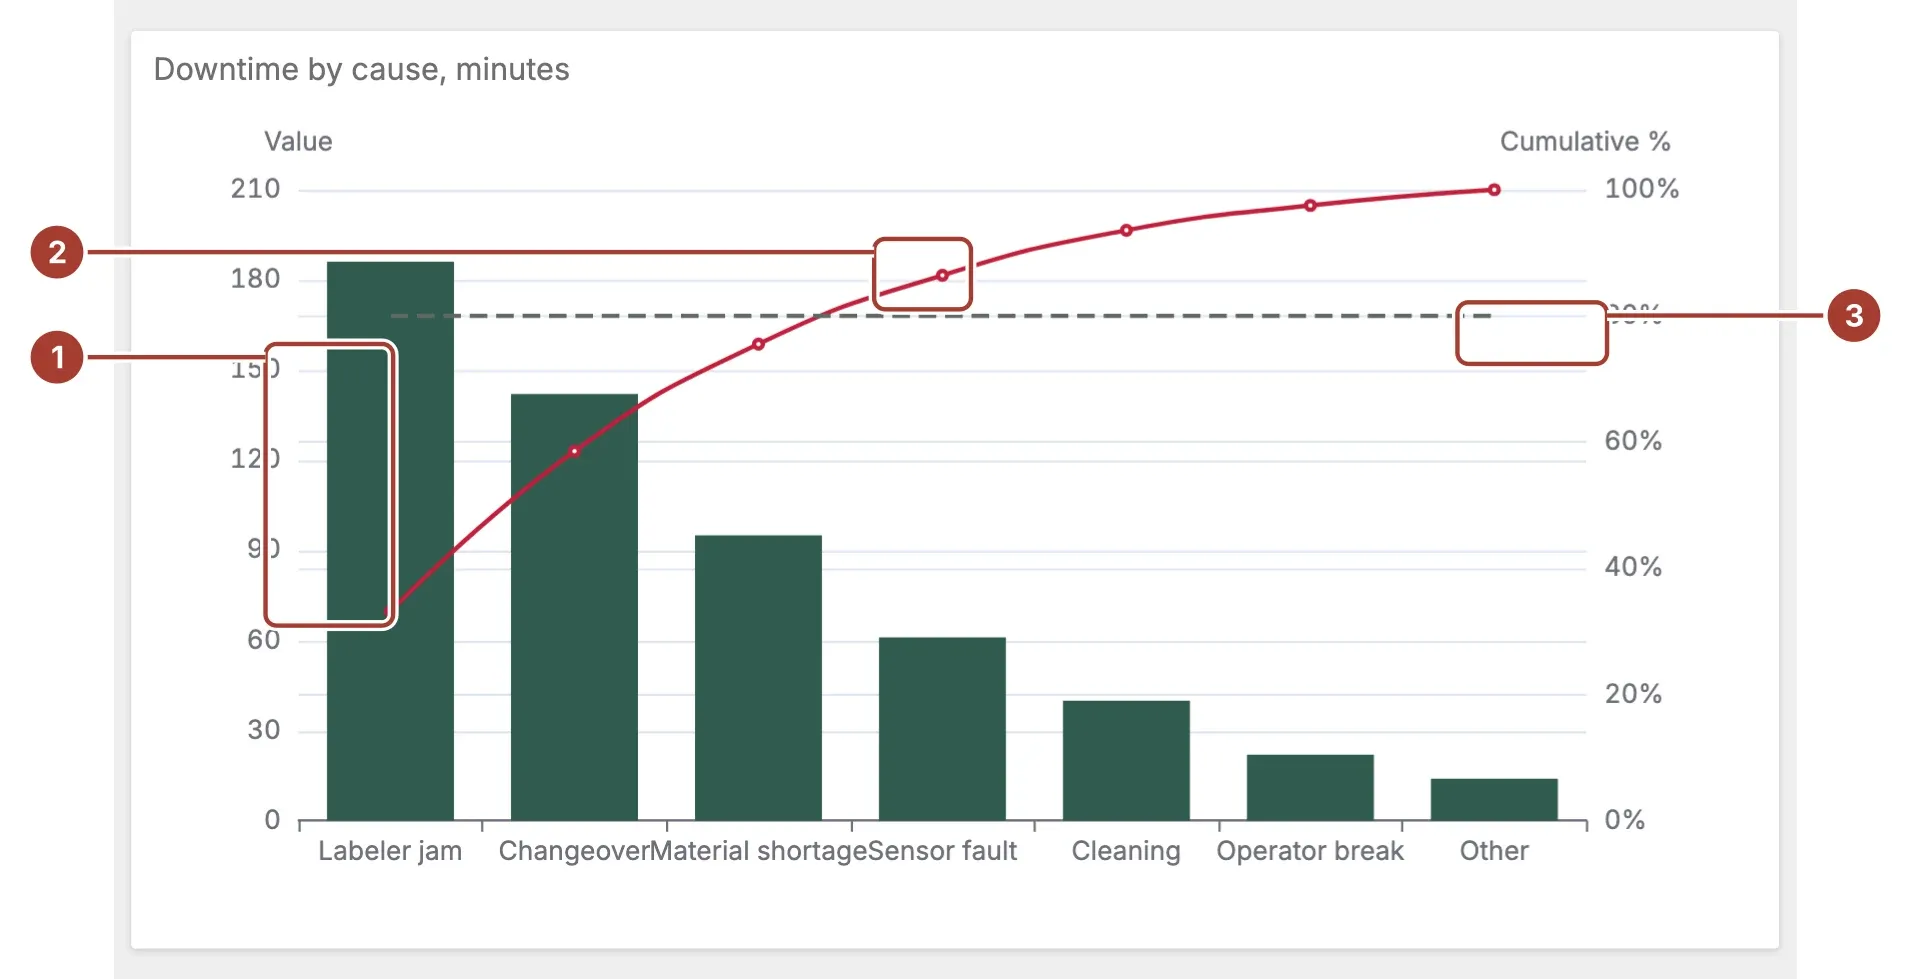
- Bar. One bar per category, largest first. Its height is read on the left axis.
- Cumulative line. With Show Cumulative Line on, the line shows the running share of the total, read on the right axis from 0 to 100 %. In the sample, the first three causes make up 76 % of the downtime.
- Target line. With Show Target Line on, a dashed line marks the Target percent. The bars to the left of where the cumulative line crosses it are the causes to work on first.
Point at a category for its value and cumulative share. When the item filters the dashboard or drills down, selecting a bar applies its category.
Data fields
| Field | Kind |
|---|---|
| Category | Dimension |
| Value | Measure |
Category and Value are required; without them the chart stays empty. The item sorts the categories by value itself, so the field's own sort order does not matter. A category without a number is left out.
Settings
| Setting | Values | Default |
|---|---|---|
| Top N | A number from 0 to 200 | 0 |
| Show Cumulative Line | No, Yes | Yes |
| Target percent | A number from 1 to 100 | 80 |
| Show Target Line | No, Yes | No |
- Top N keeps only the largest categories. The cumulative share is then worked out over the bars shown, so the line still ends at 100 %. Leave it at 0 to show every category.
- Target percent is the share the target line marks, 80 % by default.
Related
Was this page helpful?
Evaluating Proxus? See it on your own machines in a 30-minute technical session.