Reference · for Engineers, Operators
Polar chart
A dashboard item that draws a radar chart, with one spoke per argument value and one closed line per measure, to compare a few series around a cycle.
The Polar chart draws a radar chart: a web-shaped grid with one spoke per value of the argument, and one closed line per measure around it. Use it to compare a few series over something that repeats or has no natural start, such as the days of the week, the shifts of a day or the stations of a line.
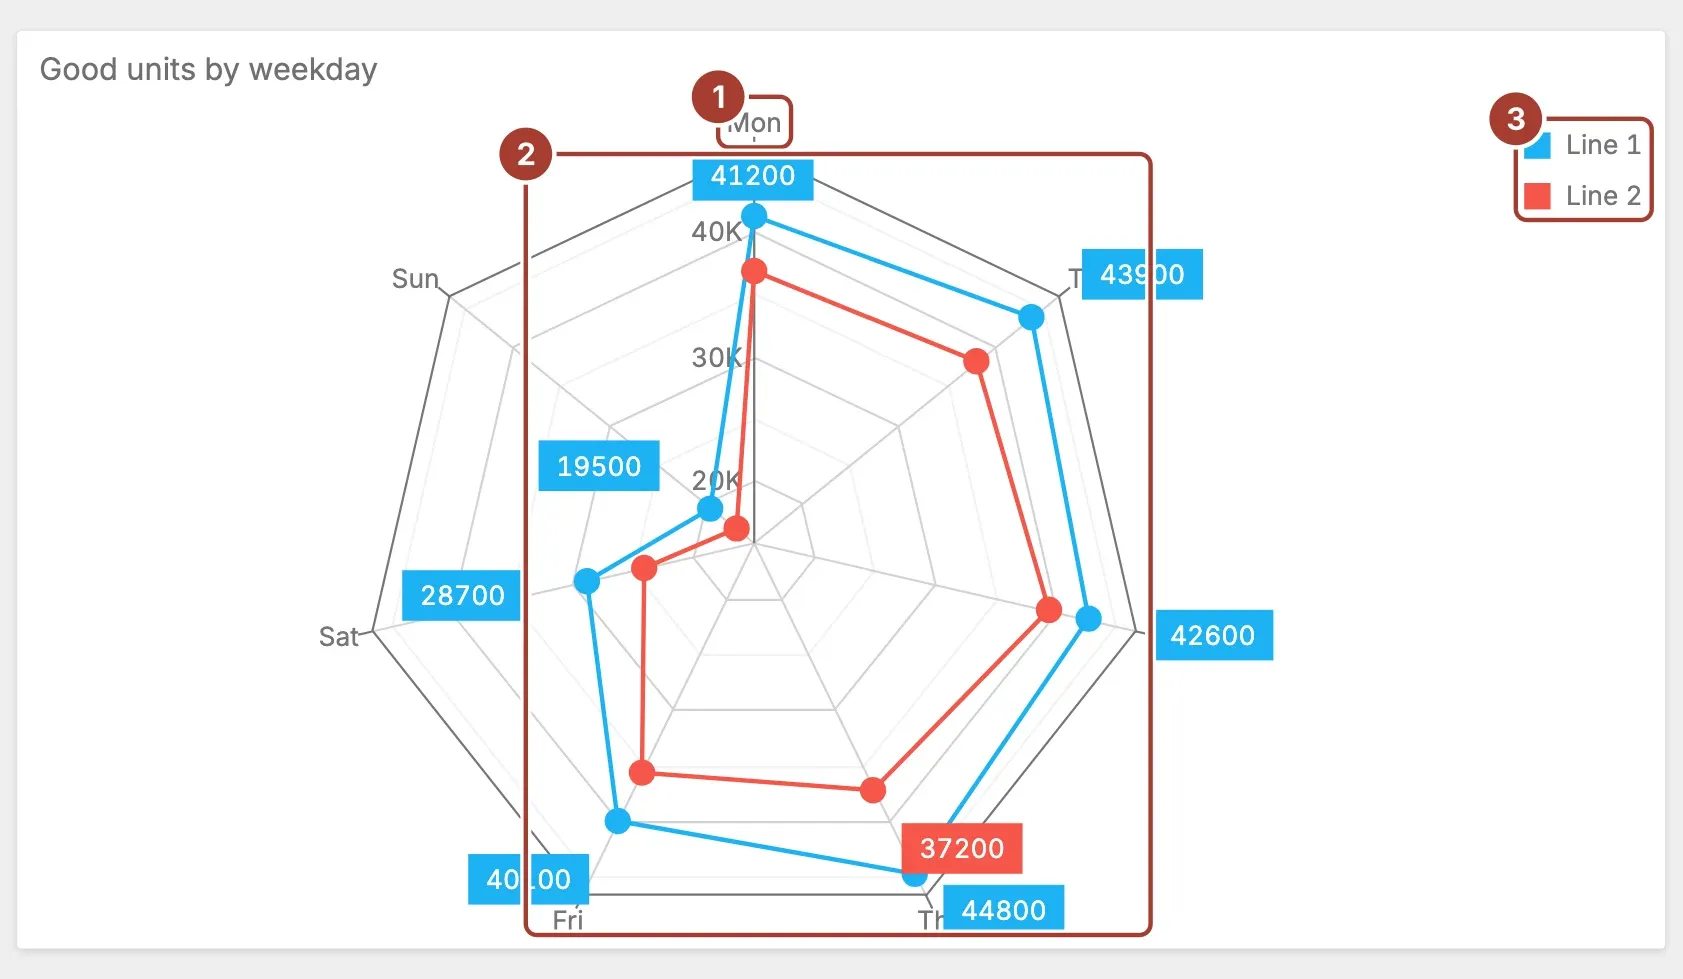
- Spoke. One value of the Argument field, such as a weekday, with its name at the outer end. The distance from the centre is the value.
- Series. One field of Value, drawn as a line that joins its points around the web. With Display labels on, each point shows its value; labels that would overlap are hidden.
- Legend. The name of each series and its colour.
Select a point to filter the other items of the dashboard by that argument value. The selected points are highlighted.
Data fields
| Field | Kind |
|---|---|
| Value | Measure (one or more) |
| Argument | Dimension |
Add one or more fields to Value; without one the chart stays empty. Each field becomes one line. Argument is a single dimension that gives the spokes, in the order of its rows, so sort it the way the cycle runs (Monday to Sunday, for example).
Settings
| Setting | Values | Default |
|---|---|---|
| Display labels | Yes, No | Yes |
- Display labels writes the value next to each point. Turn it off when the lines are close together and the numbers crowd the chart.
Related
Was this page helpful?
Evaluating Proxus? See it on your own machines in a 30-minute technical session.