Reference · for Engineers, Operators
Waterfall chart
A dashboard item that shows how a starting value rises or falls step by step, with an optional total bar.
The Waterfall chart shows how a starting value changes step by step until it reaches a result. Use it to explain where something went: planned time lost to stops, a budget spent by cost type, a production target reduced by rejects.
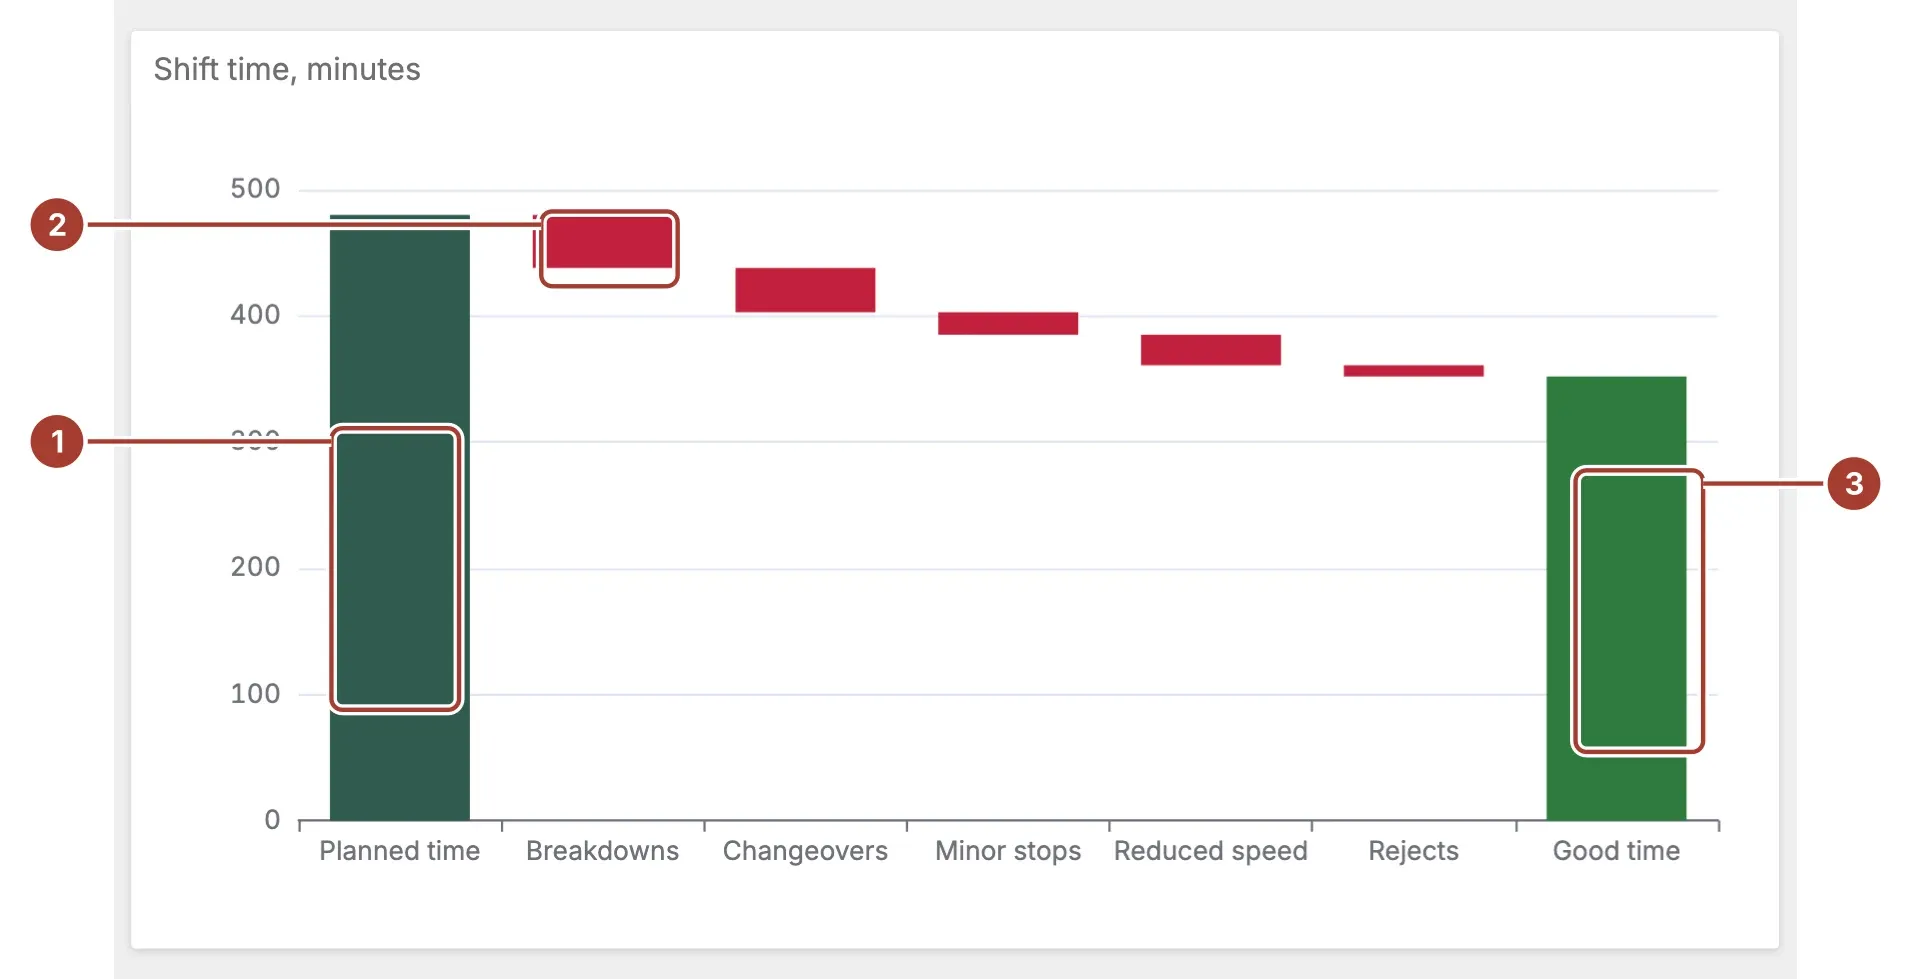
- Starting bar. The first category, here the planned time of the shift. A positive value takes the theme's first colour.
- Step. One bar per category after it, starting where the one before it ended. A negative value, such as a loss, steps down and is red.
- Total bar. With Show Total on, a green bar at the end shows the sum of all the values, here 480 minus the 128 minutes of losses.
Point at a bar for its category and value. When the item filters the dashboard or drills down, selecting a bar applies its category.
Data fields
| Field | Kind |
|---|---|
| Category | Dimension |
| Value | Measure |
Category and Value are required; without them the chart stays empty. Each category is one bar, in the order the Category field sorts them, so set its sort order to put the starting value first. Give the starting value as a positive number and each loss as a negative one. A category without a number is left out.
Settings
| Setting | Values | Default |
|---|---|---|
| Show Total | No, Yes | Yes |
| Total label | Text | Total |
- Show Total adds the total bar at the end.
- Total label names the total bar, for example
Good time. Left empty, the bar is called Total in the user's language.
Related
Was this page helpful?
Evaluating Proxus? See it on your own machines in a 30-minute technical session.