Reference · for Engineers, Operators
Timeline
A dashboard item that draws one row per machine or category and a coloured bar for each period, such as a machine state from its start to its end.
The Timeline draws periods on a time axis: one row per category, one bar per period, coloured by its status. Use it to see when each machine ran, waited or stopped, and how the states of several machines line up: a line overview, a shift report, a downtime review.
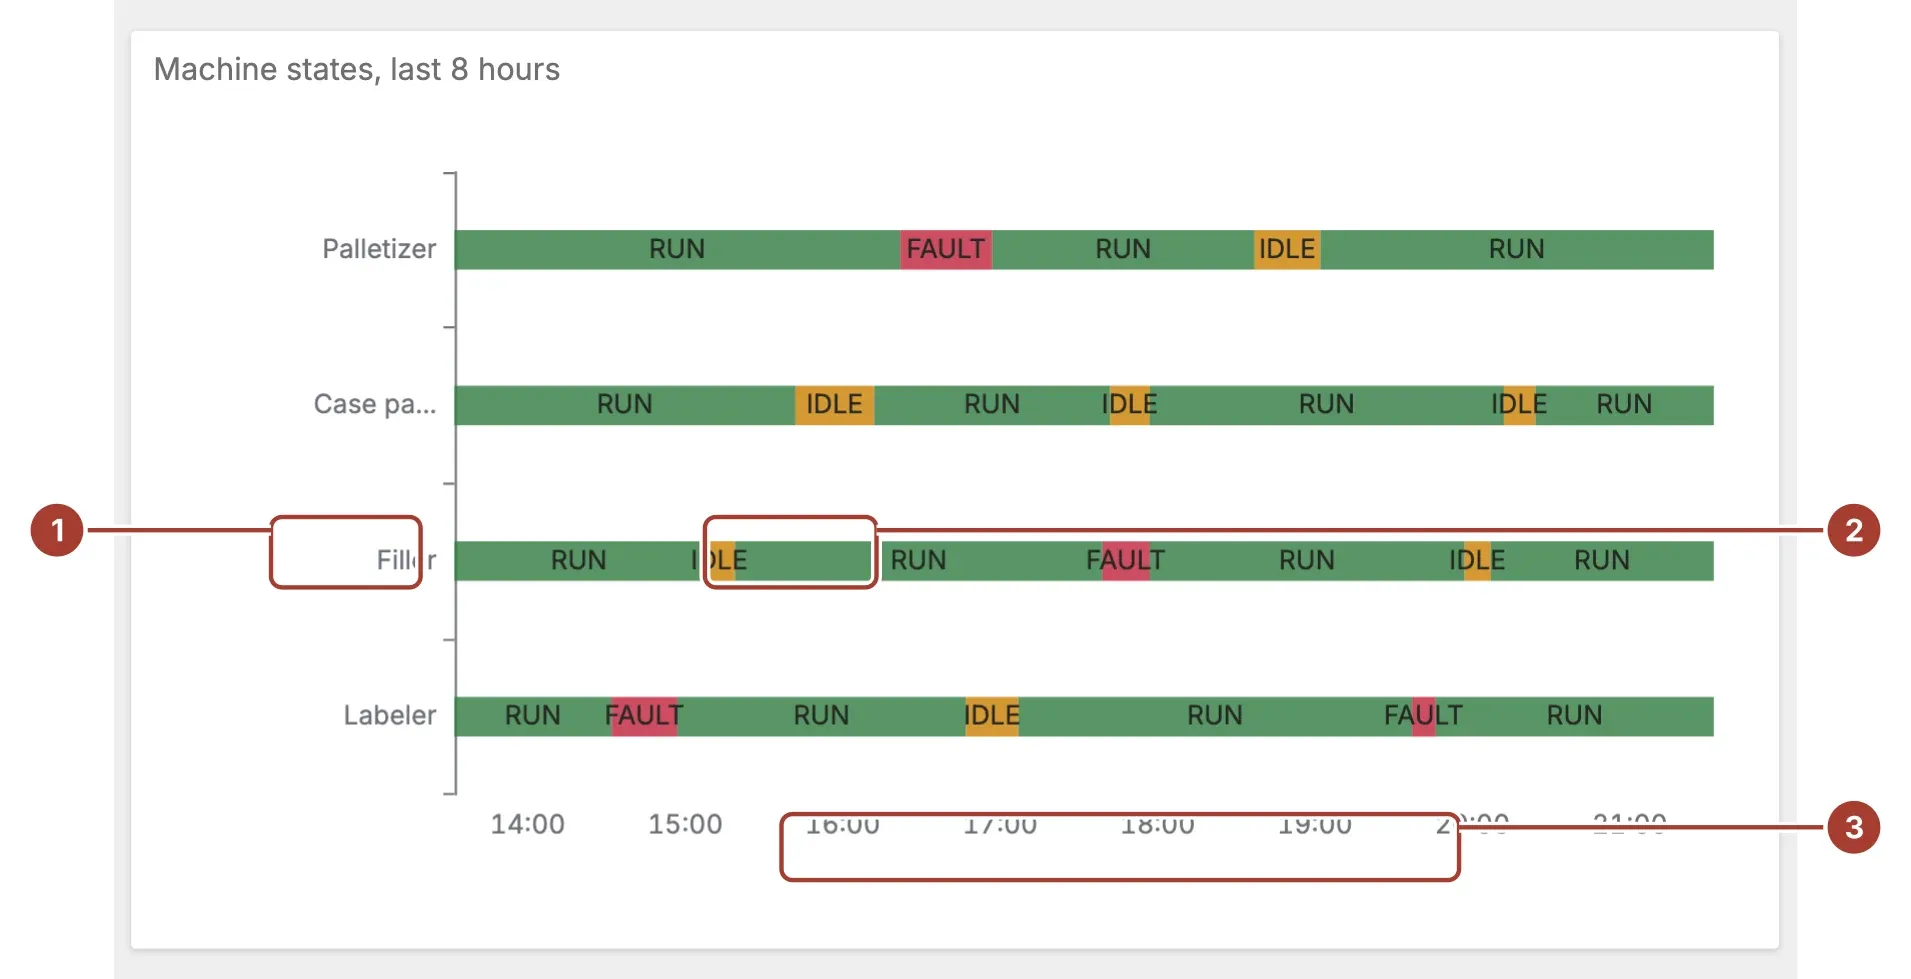
- Row. One row per value of the Category field, such as a machine. Rows appear in the order the data first gives them.
- Bar. One period, from its Start Time to its End Time, coloured by its Status. With Show Labels on, the status is written inside the bar. Hover a bar to see its status, start and end.
- Time axis. The time covered by the data, shared by every row.
Select a bar to filter the other items of the dashboard by that row, or to drill down if the item has a drill-down set up.
Data fields
| Field | Kind |
|---|---|
| Start Time | Dimension |
| End Time | Dimension |
| Category | Dimension |
| Status | Dimension |
Start Time, End Time and Category are required; without them the item stays empty. Bind date-time fields to Start Time and End Time; a row whose start or end cannot be read as a date is left out. Status is optional: without it every bar is labelled State and gets the same colour.
Settings
| Setting | Values | Default |
|---|---|---|
| Row height | A number from 8 to 40 | 18 |
| Gap | A number from 0 to 20 | 4 |
| Show Labels | No, Yes | Yes |
| Status color map | Text | {"RUN":"#2f7a3e","IDLE":"#cc8000","FAULT":"#c2203b","*":"#315b50"} |
| Auto Color | No, Yes | Yes |
| Palette | Set2, Pastel, Bold | Set2 |
| Default color | Text | #315b50 |
Row height is the height of each bar in pixels, from 8 to 40.
Auto Color gives each status the next colour of Palette, in the order the statuses appear. It is on by default. Turn it off to colour statuses with Status color map.
Status color map is a JSON object from status text to colour. The text must match the status exactly. The
*key colours every status the map does not name:{"RUN": "#2f7a3e", "IDLE": "#cc8000", "FAULT": "#c2203b", "*": "#315b50"}Default color is used when Auto Color is off and the map is empty, is not valid JSON, or has neither the status nor
*.
Related
Was this page helpful?
Evaluating Proxus? See it on your own machines in a 30-minute technical session.